. 2018 May 23;9(1):2036.
doi: 10.1038/s41467-018-04376-5.

A20 critically controls microglia activation and inhibits inflammasome-dependent neuroinflammation

Affiliations

A20 critically controls microglia activation and inhibits inflammasome-dependent neuroinflammation

Sofie Voet et al. Nat Commun. .

Abstract

Microglia, the mononuclear phagocytes of the central nervous system (CNS), are important for the maintenance of CNS homeostasis, but also critically contribute to CNS pathology. Here we demonstrate that the nuclear factor kappa B (NF-κB) regulatory protein A20 is crucial in regulating microglia activation during CNS homeostasis and pathology. In mice, deletion of A20 in microglia increases microglial cell number and affects microglial regulation of neuronal synaptic function. Administration of a sublethal dose of lipopolysaccharide induces massive microglia activation, neuroinflammation, and lethality in mice with microglia-confined A20 deficiency. Microglia A20 deficiency also exacerbates multiple sclerosis (MS)-like disease, due to hyperactivation of the Nlrp3 inflammasome leading to enhanced interleukin-1β secretion and CNS inflammation. Finally, we confirm a Nlrp3 inflammasome signature and IL-1β expression in brain and cerebrospinal fluid from MS patients. Collectively, these data reveal a critical role for A20 in the control of microglia activation and neuroinflammation.


Conflict of interest statement

The authors declare no competing interests.

Figures
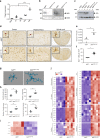
Fig. 1
Fig. 1
CNS phenotype of A20Cx3Cr1-KO mice. a A20 expression during microglial cell development. Cells were sorted according to Kierdorf et al.. A1 immature CD45+ c-kitlo Cx3Cr1 cells (yolk sac), A2 mature CD45+ c-kit Cx3Cr1+ cells (yolk sac), AM: adult microglia, EM: embryonic microglia (E14), EMP: erythromyeloid precursors (yolk sac). Each symbol represents one mouse, n = 3 per group. Data presented as mean ± SEM. Significant differences determined by a one-way ANOVA with Tukey correction for multiple comparison (****p < 0.0001). b Immunoblot for A20 expression on ex vivo FACS-sorted microglia from control (A20FL) and A20Cx3Cr1-KO mice 4 (left) or 35 weeks (right) after TAM injection. Actin is shown as loading control. c Immunoblot for A20 expression on lysates from primary microglia from control (A20FL) and A20Cx3Cr1-KO mice after stimulation with 4-OH-TAM. Actin is shown as loading control. Data are representative of two independent experiments. d Immunohistochemistry for Iba-1+ in the cerebral cortex, hippocampus, and spinal cord of control (A20FL) and A20Cx3Cr1-KO mice. Scale bars: 100 µm (cortex and hippocampus) and 200 µm (spinal cord), insert: 10 and 20 µm, respectively. Representative images are displayed. e Flow cytometric quantification of the number of CD45int CD11b+ microglia in brain of control (A20FL) and A20Cx3Cr1-KO mice 4 weeks post TAM injection. Each symbol represents one mouse. Data are representative of two independent experiments and presented as mean ± SEM. Significant differences determined by Mann–Whitney U-statistical test (*p < 0.05). f Number of Iba-1+ ramified parenchymal microglia. Each symbol represents one mouse, with four mice per group. Data presented as mean ± SEM. Significant differences determined by a Mann–Whitney U-statistical test (*p < 0.05). g, h 3D reconstruction (scale bars: 10 µm) (g) and Imaris-based quantification of cell morphology (h) of cortical Iba-1+ microglia. Each symbol represents one mouse; three cells analyzed per mouse; n = 5 per condition. Data presented as mean ± SEM. Significant differences determined by a Mann–Whitney U-statistical test (**p < 0.01). i, j RNA sequencing on FACS-sorted microglia from TAM-injected control (A20FL) and A20Cx3Cr1-KO mice. Each column represents microglia from one individual mouse, n = 5 per group. Color code presents linear scale. Pathway analysis of RNA-seq datasets demonstrates downregulation of homeostatic genes (i) and upregulation of genes involved in microglia activation, polarization, MHC class I, interferon and inflammatory signaling (j) in A20Cx3Cr1-KO microglia
Fig. 2
Fig. 2
Effect of microglia hyperactivation on basal network activity in somatosensory pyramidal neurons. a Example action potential (AP) firing profiles, showing the typical regular spiking behavior of layer V S1 pyramidal neurons both in control and in A20Cx3Cr1-KO neurons. Responses to hyperpolarizing (−150 pA) and suprathreshold (400 pA) current injections are shown. b Example sEPSC traces, 2s stretches. c Examples of individual sEPSC events. Individual events shown in gray, averaged event shown as overlay (control, black; A20Cx3Cr1-KO, red). d Cumulative probability distributions of inter-event sEPSC intervals (IEIs) for control (black) or A20Cx3Cr1-KO (red) cells. e sEPSC frequency (control (black) 5.76 ± 0.58 Hz, n/m = 21/3; A20Cx3Cr1-KO (red) 14.8 ± 1.29 Hz, n/m = 20/3; ****p < 0.0001). Data represents means ± SEM. Number of cells (n), number of animals (m). Statistical differences were determined by a two-tailed Wilcoxon matched-paired t-test. f Cumulative probability distributions for sEPSC amplitudes in control (black) or A20Cx3Cr1-KO (red) cells. g sEPSC amplitudes (control 19.3 ± 0.69 pA, n/m = 21/3; A20Cx3Cr1-KO 16.5 ± 0.87 pA, n/m = 20/3; **p = 0.0013). Data represents means ± SEM. Number cells (n), number of animals (m). Statistical differences were determined by a two-tailed unpaired Mann–Whitney t-test. h Cognitive flexibility in Morris water maze reversal learning was similar in control (A20FL, n = 12) and A20Cx3Cr1-KO mice (n = 9). i In the reversal probe trial, controls displayed significant target quadrant preference, while A20Cx3Cr1-KO mice did not (T: target quadrant, O: opposite quadrant, A1: adjacent 1 quadrant, A2: adjacent 2 quadrant). Chance level at 25% is indicated. j During the reversal probe trial, control animals searched closer to the correct reversal location for the platform than to the old location (distance to platform), while A20Cx3Cr1-KO mice searched at equidistance to both locations. All data (hj) are represented as means ± SEM and statistical differences were determined by repeated measures two-way ANOVA (h, i) and two-way ANOVA (j) using Bonferroni correction for post hoc analysis (hj) (*p < 0.05, **p < 0.01, ***p < 0.001, ****p < 0.0001)
Fig. 3
Fig. 3
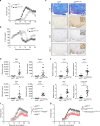
A20Cx3Cr1-KO mice are hypersensitive to LPS. a Rectal body temperature responses and b survival were analyzed in function of time in control (A20FL; n = 13) and A20Cx3Cr1-KO (n = 14) mice after intraperitoneal injection of 3.5 mg/kg LPS. The combined results of three independent experiments are shown. Body temperature data are means ± SEM. Statistical differences were determined by a REML analysis for rectal body temperatures and a Mantel–Cox test for the survival curve (**p < 0.01, ***p < 0.001). c Immunohistochemistry images showing Iba-1+ expression in the cerebral cortex, hippocampus and spinal cord of control (A20FL) and A20Cx3Cr1-KO mice 10 h post LPS challenge. Scale bars represent 100 µm (cortex and hippocampus) and 200 µm (spinal cord), insert: 10 and 20 µm, respectively. Representative images are displayed. Data are representative of two independent experiments. d Number of Iba-1+ ramified parenchymal microglia in brain. Each symbol represents data from one mouse, n = 4 per group. Data are presented as mean ± SEM. Significant differences were determined by a two-way ANOVA with Tukey correction for multiple comparison (*p < 0.05, ****p < 0.0001). e, f Three-dimensional reconstruction (scale bars represent 10 µm, e) and Imaris-based semiautomatic quantification of cell morphology (f) of cortical Iba-1+ microglia. Each symbol represents the average of three measured cells per mouse; n = 5 per group. Data are presented as mean ± SEM. Significant differences were determined by two-way ANOVA with Tukey correction for multiple comparison (**p < 0.01, ***p < 0.001, ****p < 0.0001). g Bioplex analysis of cytokine levels in CSF 10 h post LPS. Each symbol represents one mouse. Data are representative of three independent experiments. Significant differences were determined by a one-way ANOVA with Tukey correction for multiple comparison (**p < 0.01, ****p < 0.0001). h RNA prepared from FACS-sorted microglia from control (A20FL) and A20Cx3Cr1 mice either or not injected with LPS for 10 h was submitted for RNA sequencing. Heat map of expression values for inflammatory genes that are upregulated in LPS-stimulated A20Cx3Cr1 microglia compared with LPS-stimulated control microglia. Each column represents microglia data from one individual mouse, with four or five mice per group. Color code presents linear scale
Fig. 4
Fig. 4
A20Cx3Cr1-KO microglia are hypersensitive to Nlrp3 inflammasome activation. a IL-1β mRNA expression in microglia from A20Cx3Cr1-KO mice compared with control mice either or not injected with LPS. Data are presented as mean ± SEM. Significant differences were determined by a Mann–Whitney t-test (*p < 0.05, **p < 0.01). b IL-1β and IL-18 protein levels in the supernatant of primary cultured microglia stimulated with LPS alone or together with ATP, silica, or nigericin. Data represent the mean ± SD of three technical replicates of pooled microglial cells from control (A20FL) and A20Cx3Cr1-KO mice. Data are representative of three independent experiments. c Immunoblot for procaspase-1 and cleaved caspase-1 (p20) in primary cultured microglia from control (A20FL) and A20Cx3Cr1-KO mice stimulated with LPS and/or ATP. Actin is shown as loading control. Data are representative of two independent experiments. d Pyroptosis induction in primary microglia from control (A20FL) and A20Cx3Cr1-KO mice stimulated with LPS and ATP, as measured by Sytox Green uptake. Data are presented as mean ± SEM and are representative of two independent experiments. Significant differences were determined by a REML analysis (****p < 0.0001). e Immunoblot showing procaspase-1 and cleaved caspase-1 in primary cultured microglia from control (A20FL) and A20Cx3Cr1-KO mice either or not pretreated in vitro with TPCA-1 and stimulated with LPS and/or ATP. Actin is shown as loading control. Data are representative of two independent experiments. f IL-1β protein in supernatant of primary cultured microglia from control (A20FL) and A20Cx3Cr1-KO mice either or not pretreated in vitro with TPCA-1 and stimulated with LPS and/or ATP. Data represent the mean ± SD of three technical replicates of pooled microglial cells, and are representative of two independent experiments
Fig. 5
Fig. 5
Microglia A20 deficiency aggravates autoimmune CNS inflammation due to Nlrp3 inflammasome hyperactivation. a, b EAE was induced by active immunization of control A20FL (n = 6) and A20Cx3Cr1-KO mice (n = 10) with MOG peptide, and clinical disease development (a) and body weight (b) was followed over time. Each data point represents the mean ± SEM as estimated by the REML analysis. Changes in clinical score and relative body weight differ significantly (***p < 0.001; F-test) between genotypes across the time span. Data are representative of three independent experiments. c Representative images of spinal cord of control (A20FL) and A20Cx3Cr1-KO mice 13 days post immunization using LFB, APP, CD3, and MAC-3 antibodies. Scale bars represent 200 µm (overview) and 20 µm (zoom). Representative images from at least four mice per group are displayed. d Assessment of immune cell (CD3, CD4, and CD8 T cell, Treg) infiltration in the CNS of control (A20FL) and A20Cx3Cr1-KO mice by flow cytometry just before disease onset. Each symbol represents one mouse. Data are expressed as mean ± SEM and significant differences are determined by a Mann–Whitney U-statistical test (***p < 0.001, ****p < 0.0001). e Expression of inflammasome-associated factors in the spinal cord of TAM-injected control (A20FL) and A20Cx3Cr1-KO mice 12 days post immunization. Each symbol represents one mouse. Data are expressed as the ratio of the mRNA expression normalized to endogenous housekeeping genes and expressed as mean ± SEM. Significant differences are determined by a Mann–Whitney U-statistical test (****p < 0.0001). f, g Active immunization of control (A20FL, n = 11), A20Cx3Cr1-KO (n = 10), Nlrp3KO (n = 18), and A20Cx3Cr1-KO-Nlrp3KO (n = 8) mice (f) and of control (A20FL, n = 28), A20Cx3Cr1-KO (n = 15) and A20/caspase-1Cx3Cr1-KO (n = 13) mice (g), and clinical disease development over time. Each data point represents the mean ± SEM as estimated by the REML analysis. Changes in clinical score and relative body weight differ significantly between genotypes across the time span (*p < 0.05, **p < 0.01, ***p < 0.001; F-test). Graph represents combined data from three independent experiments
Fig. 6
Fig. 6
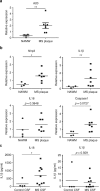
Enhanced A20 expression and NLRP3 inflammasome activation in human MS samples. a, b Relative gene expression levels of A20/TNFAIP3 (a) and of inflammasome-associated factors (b) in plaques of postmortem MS patients (plaque) or postmortem control tissue (NAWM). Each symbol represents one patient. Data are expressed as the ratio of the mRNA expression normalized to endogenous housekeeping genes (Sdha and Tbp) and expressed as mean ± SEM. Significant differences are determined by Mann–Whitney U-statistical test (*p < 0.05, **p < 0.01). c IL-1β and IL-18 cytokine levels in the CSF of postmortem MS patients or control samples. Each symbol represents one CSF sample. Significant differences are determined by Mann–Whitney U-statistical test (*p < 0.05)

Similar articles

Cited by

References

    1. Shemer A, Erny D, Jung S, Prinz M. Microglia plasticity during health and disease: an immunological perspective. Trends Immunol. 2015;36:614–624. doi: 10.1016/j.it.2015.08.003. - DOI - PubMed
    1. Biber K, Möller T, Boddeke E, Prinz M. Central nervous system myeloid cells as drug targets: current status and translational challenges. Nat. Rev. Drug. Discov. 2016;15:110–124. doi: 10.1038/nrd.2015.14. - DOI - PubMed
    1. Prinz M, Priller J. Microglia and brain macrophages in the molecular age: from origin to neuropsychiatric disease. Nat. Rev. Neurosci. 2014;15:300–312. doi: 10.1038/nrn3722. - DOI - PubMed
    1. Liddelow SA, et al. Neurotoxic reactive astrocytes are induced by activated microglia. Nature. 2017;541:481–487. doi: 10.1038/nature21029. - DOI - PMC - PubMed
    1. Goldmann T, et al. A new type of microglia gene targeting shows TAK1 to be pivotal in CNS autoimmune inflammation. Nat. Neurosci. 2013;16:1618–1626. doi: 10.1038/nn.3531. - DOI - PubMed

Publication types

MeSH terms