. 2018 Jun 1;22(6):929-940.e4.
doi: 10.1016/j.stem.2018.04.022. Epub 2018 May 17.

High-Throughput Screening Enhances Kidney Organoid Differentiation from Human Pluripotent Stem Cells and Enables Automated Multidimensional Phenotyping

Affiliations

High-Throughput Screening Enhances Kidney Organoid Differentiation from Human Pluripotent Stem Cells and Enables Automated Multidimensional Phenotyping

Stefan M Czerniecki et al. Cell Stem Cell. .

Abstract

Organoids derived from human pluripotent stem cells are a potentially powerful tool for high-throughput screening (HTS), but the complexity of organoid cultures poses a significant challenge for miniaturization and automation. Here, we present a fully automated, HTS-compatible platform for enhanced differentiation and phenotyping of human kidney organoids. The entire 21-day protocol, from plating to differentiation to analysis, can be performed automatically by liquid-handling robots, or alternatively by manual pipetting. High-content imaging analysis reveals both dose-dependent and threshold effects during organoid differentiation. Immunofluorescence and single-cell RNA sequencing identify previously undetected parietal, interstitial, and partially differentiated compartments within organoids and define conditions that greatly expand the vascular endothelium. Chemical modulation of toxicity and disease phenotypes can be quantified for safety and efficacy prediction. Screening in gene-edited organoids in this system reveals an unexpected role for myosin in polycystic kidney disease. Organoids in HTS formats thus establish an attractive platform for multidimensional phenotypic screening.


Figures

Figure 1
Figure 1. Generation of organoid plates in automated HTS formats
(A) Schematic of organoid plate production. (B) Representative wells of 96-well and 384-well kidney organoid plates at identical magnification, showing phase contrast image with proximal tubule (LTL) overlay in green. Zoom of boxed region (arrowhead) is shown below. (C) Representative wells of a 384-well organoid plate labeled with nephron segment markers of proximal tubule (LTL), distal tubule (ECAD), and podocytes (NPHS1), showing progressive zoom of yellow boxed regions. Scale bars, 100 µm. See also related Figure S1.
Figure 2
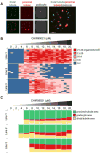
Figure 2. Utilization of organoid HTS plates to optimize differentiation
(A) Representative well of a 384-well organoid plate (top row) robotically plated, differentiated, fixed, stained, imaged for proximal tubule (LTL), distal tubule (ECAD), and podocyte (NPHS1) segments. Magenta overlay (bottom row) shows automatically-identified structures over actual staining. Scale bar, 1 mm. (B) Quantification of organoids/well in automated 384-well plates with increasing CHIR concentrations. Each box represents a single well. White boxes represent wells lost to fungal contamination. Z’ factors for organoid differentiation in the three lines were calculated to be 0.596 (Line 1), 0.034 (Line 2), and 0.285 (Line 3). (C) Quantification of proximal tubules (green), distal tubules (yellow), and podocytes (red) at these different CHIR concentrations. Each condition shows the average of 32 wells (2 columns), and 14 µM shows the average of 64 wells. Conditions in which organoids did not differentiate efficiently (< 5 organoids total) were not included in the analysis and appear blank. See also related Figure S2.
Figure 3
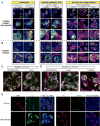
Figure 3. Microwell plates reveal detailed patterning of oranoids similar to tissues in vivo
(A) Representative images of kidney organoids in microwell plates subjected to immunofluorescence analysis for segment-specific markers. Top row shows wide-field immunofluorescence image taken with a 4X objective. Middle row shows confocal image of the organoid highlighted above in the boxed region, taken with a 40X objective. Bottom row shows zoom of boxed region from middle row. ZO-1 (column 2) and CLDN1 (column 3) were labeled in the far red and red channels, respectively, in the same sample. Each of these is pseudocolored red and displayed separately to show co-localization with NPHS1 in the green. (B) 40X images (top) with zoom (bottom) of the same marker combinations in developing kidneys. Arrowheads (CFTR and CLDN1) indicate specific patterns in organoids and tissues. (C–D) Confocal images of organoids with progressive zooms, showing PEC-like marker expression in capsules surrounding podocytes, compared to human kidney tissue (right). (E) Confocal images of collecting duct markers, counterstained with LTL, in organoids and tissues. Scale bars, 100 µm. See also related Figure S3.
Figure 4
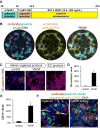
Figure 4. Optimization of vascularization in organoids
(A) Schematic of differentiation protocol used for vascular optimization. (B) One well of a 96-well organoid plate treated with 100 ng/ml VEGF, showing podocytes (SYNPO), proximal tubules (LTL), and EC (CD31) by wide-field immunofluorescence. (C) Wide-field images of VE-cadherin immunofluorescence in organoid cultures ± VEGF (left) or EC-directed cultures (right). (D) Percentage of the total culture area occupied by cells expressing VE-cadherin, averaged from four representative experiments, or (E) expressing CD31, averaged from two additional representative experiments (± stderr). (F) Confocal optical sections showing EC (CD31+) in optimized organoids, compared to human kidney sections. Scale bars, 200 µm.
Figure 5
Figure 5. Single cell RNA sequencing reveals that enhanced organoids contain epithelial and endothelial cell types analagous to developing human kidneys
(A) t-SNE plot showing cell populations in kidney organoids, identified by clustering similar single cell transcriptomes. (B) Top differentially expressed genes (DEG) within cells of these clusters compared to other cell clusters. All genes are present in corresponding developing human kidney (DHK) cell clusters, and bold if also in P1 mouse kidney cell clusters of same lineage. (C) Correlation matrix comparing average gene expression of kidney organoid and DHK cell clusters. (D) Violin plots of genes-of-interest within these cell clusters. (E) Overlay t-SNE plots from 4 individual datasets ± VEGF differentiation. Inset highlights mature endothelial cell cluster. Data representative of 3 experimental replicates. (F) t-SNE plot and (G) top differentially expressed genes of cells in subclusters of Stromal cluster from (A). Dotted line around subcluster S4 (F, H, I) highlights cells only detected with VEGF treatment. (H) Overlay t-SNE plots of Stromal subclusters (F) for 4 individual datasets ± VEGF differentiation, colored as in (E). (I) Feature (t-SNE) plots highlighting MCAM expression in Stromal subclusters (F, H) relative to VEGF treatment. (J) Representative wide-field immunofluorescent images of MCAM and CD31 in cells in organoid cultures ± VEGF. Scale bar, 500 µm. Gene names not italicized for ease of viewing (B, D, G). See also related Figure S4.
Figure 6
Figure 6. Organoid HTS plates model toxicity and disease phenotypes
(A) Individual organoids treated with increasing cisplatin doses showing phase-contrast effects on tubular integrity, (B) quantification of cell survival, (C) KIM-1 expression detected by ELISA, and (D) KIM-1 immunofluorescence. (E) Immunofluorescence images of a cyst formed in a 384-well plate from a kidney organoid with mutations disrupting the PKD2 gene. (F) Phase-contrast images of organoids tubules with or without forskolin treatment. (G) Quantification of cystogenesis induced by forskolin at increasing concentrations. (H) Schematic of multi-dimensional data in HTS organoids. Each position represents a different treatment condition. A positive hit showing normal differentiation, low toxicity, and high efficacy (phenotypic rescue) is highlighted with an asterisk in the efficacy dataset. Scale bars, 100 µm. Error bars, s.d. *, p < 0.05 (n = 3 or more experiments).
Figure 7
Figure 7. Screening reveals blebbistatin increases PKD organoid cystogenesis
(A) Cyst formation (% of cyst/organoid) from PKD organoids cultured in 96-well and treated with different compounds. Gradient triangles represent the increasing doses used for each compound. BSP, bone sialoprotein; Vitr., Vitronectin. (B) Representative images of untreated and blebbistatin-treated PKD organoids in suspension. Arrowheads indicate cysts. (C) Cyst quantification 3 days after blebbistatin treatment in suspension culture (n = 4 separate experiments, ≥ 15 organoids, ± s.e.m., p=0.0002). The difference between blebbistatin treated and untreated is shown ( Δ cyst / organoid). (D) Cyst diameters after 7 days of blebbistatin treatment in suspension culture from 4 separate experiments pooled together. Each square represents a cyst (control +blebb., n=10; PKD -blebb., n=24; PKD +blebb., n= 118; ± s.e.m., p<0.0001). (E) Representative images and quantification of PKD cyst area after removal of blebbistatin (n=8 from 2 separate experiments, ± s.e.m.; d0 versus d3, p=0.0015). Drug was removed (d0) after 7 days of treatment. A representative organoid before and after washout is shown. (F) Confocal immunofluorescence showing nephron segment markers in PKD organoid cysts (cy) induced with blebbistatin. LTL was used for labelling proximal tubules, ECAD for distal tubules, NPHS1 for podocytes and DAPI for DNA. (G) Representative confocal images showing NMIIB expression in PKD organoids. Proximal, LTL; DNA, DAPI. Arrowhead, non-cystic tubules. Scale bars, 200 µm. See also related Figure S5.

Similar articles

Cited by

References

    1. Abrahamson DR, St John PL, Stroganova L, Zelenchuk A, Steenhard BM. Laminin and type IV collagen isoform substitutions occur in temporally and spatially distinct patterns in developing kidney glomerular basement membranes. J Histochem Cytochem. 2013;61:706–718. - PMC - PubMed
    1. Adam M, Potter AS, Potter SS. Psychrophilic proteases dramatically reduce single-cell RNA-seq artifacts: a molecular atlas of kidney development. Development. 2017;144:3625–3632. - PMC - PubMed
    1. Astashkina AI, Mann BK, Prestwich GD, Grainger DW. A 3-D organoid kidney culture model engineered for high-throughput nephrotoxicity assays. Biomaterials. 2012;33:4700–4711. - PubMed
    1. Brunskill EW, Sequeira-Lopez ML, Pentz ES, Lin E, Yu J, Aronow BJ, Potter SS, Gomez RA. Genes that confer the identity of the renin cell. Journal of the American Society of Nephrology. 2011;22:2213–2225. - PMC - PubMed
    1. Chen S, Borowiak M, Fox JL, Maehr R, Osafune K, Davidow L, Lam K, Peng LF, Schreiber SL, Rubin LL, et al. A small molecule that directs differentiation of human ESCs into the pancreatic lineage. Nature Chemical Biology. 2009;5:258–265. - PubMed