. 2018 May 3:9:365.
doi: 10.3389/fphar.2018.00365. eCollection 2018.

Celastrol Attenuates the Invasion and Migration and Augments the Anticancer Effects of Bortezomib in a Xenograft Mouse Model of Multiple Myeloma

Affiliations

Celastrol Attenuates the Invasion and Migration and Augments the Anticancer Effects of Bortezomib in a Xenograft Mouse Model of Multiple Myeloma

Muthu K Shanmugam et al. Front Pharmacol. .

Abstract

Several lines of evidence have demonstrated that deregulated activation of NF-κB plays a pivotal role in the initiation and progression of a variety of cancers including multiple myeloma (MM). Therefore, novel molecules that can effectively suppress deregulated NF-κB upregulation can potentially reduce MM growth. In this study, the effect of celastrol (CSL) on patient derived CD138+ MM cell proliferation, apoptosis, cell invasion, and migration was investigated. In addition, we studied whether CSL can potentiate the apoptotic effect of bortezomib, a proteasome inhibitor in MM cells and in a xenograft mouse model. We found that CSL significantly reduced cell proliferation and enhanced apoptosis when used in combination with bortezomib and upregulated caspase-3 in these cells. CSL also inhibited invasion and migration of MM cells through the suppression of constitutive NF-κB activation and expression of downstream gene products such as CXCR4 and MMP-9. Moreover, CSL when administered either alone or in combination with bortezomib inhibited MM tumor growth and decreased serum IL-6 and TNF-α levels. Overall, our results suggest that CSL can abrogate MM growth both in vitro and in vivo and may serve as a useful pharmacological agent for the treatment of myeloma and other hematological malignancies.

Keywords: NF-κB; bortezomib; celastrol; multiple myeloma; xenograft models.


Figures
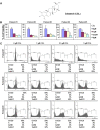
FIGURE 1
FIGURE 1
Celastrol (CSL) suppresses the proliferation of CD138+ cells derived from MM patients. (A) Chemical structure of CSL. (B) CD138+ cells were isolated from MM patient samples as described in the section “Materials and Methods.” The cells were plated in triplicate, treated with 0, 1, 2.5, and 5 μM CSL for 72 h and then subjected to MTT assay to analyze proliferation of cells. Columns, mean; bars, SD. (C) CD138+ cells from MM patient samples were plated, thereafter treated with 0, 1, 2.5, and 5 μM CSL for 72 h and then washed, fixed, stained with PI, and analyzed for DNA content by flow cytometry.
FIGURE 2
FIGURE 2
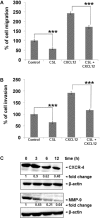
Celastrol inhibits migration and invasion of MM cell lines. (A) U266 cells (50 × 104/well) in cell culture media with and without 1 μM CSL was added to the top chambers of 24-well transwell inserts with 8-μm pores. Cell culture medium (600 μl) containing the recombinant human B-cell chemoattractant, CXCL12 was added to the bottom chamber and incubated for 12 h. After incubation, the transwell migration toward CXCL12 was measured using calcein-AM (5 μM) staining and measuring the fluorescence intensity. Data are expressed as percentage of cell migration. Columns, mean; bars, SD. ∗∗∗p < 0.001. (B) U266 cells (50 × 104) in suspension were starved in serum-free RPMI-1640 for 3 h, and then loaded onto the Matrigel-coated inserts in the upper chambers of tissue culture inserts placed in 24 well plates. The wells of the plate were filled with 600-μl of 10% FBS-containing cell culture media with 100 ng/ml CXCL12. CSL (1 μM) was added with the cells to the upper chamber. Plates were then incubated at 37°C for 12 h. Matrigel invasion toward CXCL12 was measured by staining the cells with calcein-AM (5 μM) and measuring the fluorescence intensity. Data are expressed as percentage of mean cell invasion. Columns, mean; bars, SD. ∗∗∗p < 0.001. (C) U266 cells were treated with CSL (1 μM) for 0, 3, 6, and 12 h at 37°C. Whole-cell extracts were prepared, separated on SDS-PAGE, and subjected to Western blot analysis using antibodies against CXCR4 and MMP-9. The same blots were stripped and reprobed with β-actin antibody to show equal protein loading. The data shown is representative of at least two independent experiments.
FIGURE 3
FIGURE 3
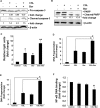
Celastrol potentiates the apoptotic effect of bortezomib in various MM cell lines. (A) U266 cells were treated with CSL (0.5 μM), bortezomib (10 nM) and a combination of both for 24 h at 37°C. Whole-cell extracts were prepared, separated on SDS-PAGE, and subjected to Western blot analysis using antibody against pro- and cleaved caspase-3. The same blots were stripped and reprobed with β-actin antibody to show equal protein loading. (B) U266 cells were treated with CSL (0.5 μM), bortezomib (10 nM) and a combination of both for 24 h at 37°C. Whole-cell extracts were prepared, separated on SDS-PAGE, and subjected to Western blot analysis using antibody against PARP. The same blots were stripped and reprobed with β-actin antibody to show equal protein loading. Results typical of two independent experiments are shown. (C) U266 cells were treated with CSL (0.5 μM), bortezomib (10 nM), and a combination of both for 24 h at 37°C. Caspase-3 activity/luminescence of each sample was measured in a plate-reading luminometer. Columns, mean; bars, SD. p < 0.05, ∗∗p < 0.01. (D) H929 cells were treated with CSL (0.5 μM), bortezomib (10 nM), and a combination of both for 24 h at 37°C. Apoptosis was determined by measuring the degree of DNA fragmentation in the cytoplasm of cells. Columns, mean; bars, SD. p < 0.05. (E) KMS-11 cells were treated with CSL (0.5 μM), bortezomib (10 nM), and a combination of both for 24 h at 37°C. Apoptosis was determined by measuring the degree of DNA fragmentation in the cytoplasm of cells. Columns, mean; bars, SD. p < 0.05. (F) U266 cells were treated with CSL (0.5 μM), bortezomib (10 nM), and a combination of both for 24 h at 37°C. Twenty micrograms of the nuclear protein was used for DNA-binding assay as described in the section “Materials and Methods.” Columns, mean; bars, SD. p < 0.05.
FIGURE 4
FIGURE 4
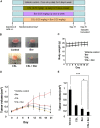
Celastrol potentiates the anti-tumor activity of bortezomib in xenograft mouse model. (A) A schematic representation of experimental protocol as described in the section “Materials and Methods.” Group I (control) received corn oil 100 μl i.p. for 5 days a week, group II received 0.25 mg/kg celastrol in 100 μl corn oil for 5 days a week, group III received 0.25 mg/kg bortezomib in 100 μl corn oil i.p. weekly, and group IV received 0.25 mg/kg celastrol in 100 μl corn oil i.p. 5 days a week and 0.25 mg/kg bortezomib in 100 μl corn oil i.p. weekly for three consecutive weeks. (B) Photographs of tumor tissue dissected from the mice after the end of treatment period. (C) The body weight of mice that was measured twice a week during the duration of the experiment. (D) Tumor size of each mice was measured using a vernier calipers twice a week for the duration of the experiment and tumor volume calculated using the formula [L ×W2]/2, where W and L are the width (short diameter) and the length (long diameter) of the tumor. (E) Tumor volumes in mice measured on the last day of the experiment with vernier calipers and calculated using the formula [L × W2]/2. Columns, mean; bars, SD. p < 0.05, ∗∗∗p < 0.001.
FIGURE 5
FIGURE 5
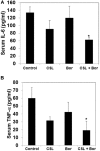
Celastrol modulates serum levels of IL-6 and TNF-α in MM tumor bearing mice. (A) All four groups of mice were treated as described in the section “Materials and Methods.” Sandwich ELISA assay was performed as per manufacturers’ instruction R&D systems (Minneapolis, MN, United States) to determine the levels of IL-6. p < 0.05. (B) All four groups of mice treated as described in the section “Materials and Methods.” Sandwich ELISA assay was performed as per manufacturers’ instruction R&D systems (Minneapolis, MN, United States) to determine the levels of TNF-α. p < 0.05.

Similar articles

Cited by

References

    1. Abdi J., Chen G., Chang H. (2013). Drug resistance in multiple myeloma: latest findings and new concepts on molecular mechanisms. Oncotarget 4 2186–2207. 10.18632/oncotarget.1497 - DOI - PMC - PubMed
    1. Ackler S., Mitten M. J., Foster K., Oleksijew A., Refici M., Tahir S. K., et al. (2010). The Bcl-2 inhibitor ABT-263 enhances the response of multiple chemotherapeutic regimens in hematologic tumors in vivo. Cancer Chemother. Pharmacol. 66 869–880. 10.1007/s00280-009-1232-1 - DOI - PubMed
    1. Agarwal A., Ghobrial I. M. (2013). Monoclonal gammopathy of undetermined significance and smoldering multiple myeloma: a review of the current understanding of epidemiology, biology, risk stratification, and management of myeloma precursor disease. Clin. Cancer Res. 19 985–994. 10.1158/1078-0432.CCR-12-2922 - DOI - PMC - PubMed
    1. Anderson K. C., Carrasco R. D. (2011). Pathogenesis of myeloma. Annu. Rev. Pathol. 6 249–274. 10.1146/annurev-pathol-011110-130249 - DOI - PubMed
    1. Annunziata C. M., Davis R. E., Demchenko Y., Bellamy W., Gabrea A., Zhan F., et al. (2007). Frequent engagement of the classical and alternative NF-κB pathways by diverse genetic abnormalities in multiple myeloma. Cancer Cell 12 115–130. 10.1016/j.ccr.2007.07.004 - DOI - PMC - PubMed