. 2018 Jun 1;128(6):2551-2568.
doi: 10.1172/JCI97426. Epub 2018 May 14.

MicroRNA-210 overexpression promotes psoriasis-like inflammation by inducing Th1 and Th17 cell differentiation

Affiliations

MicroRNA-210 overexpression promotes psoriasis-like inflammation by inducing Th1 and Th17 cell differentiation

Ruifang Wu et al. J Clin Invest. .

Abstract

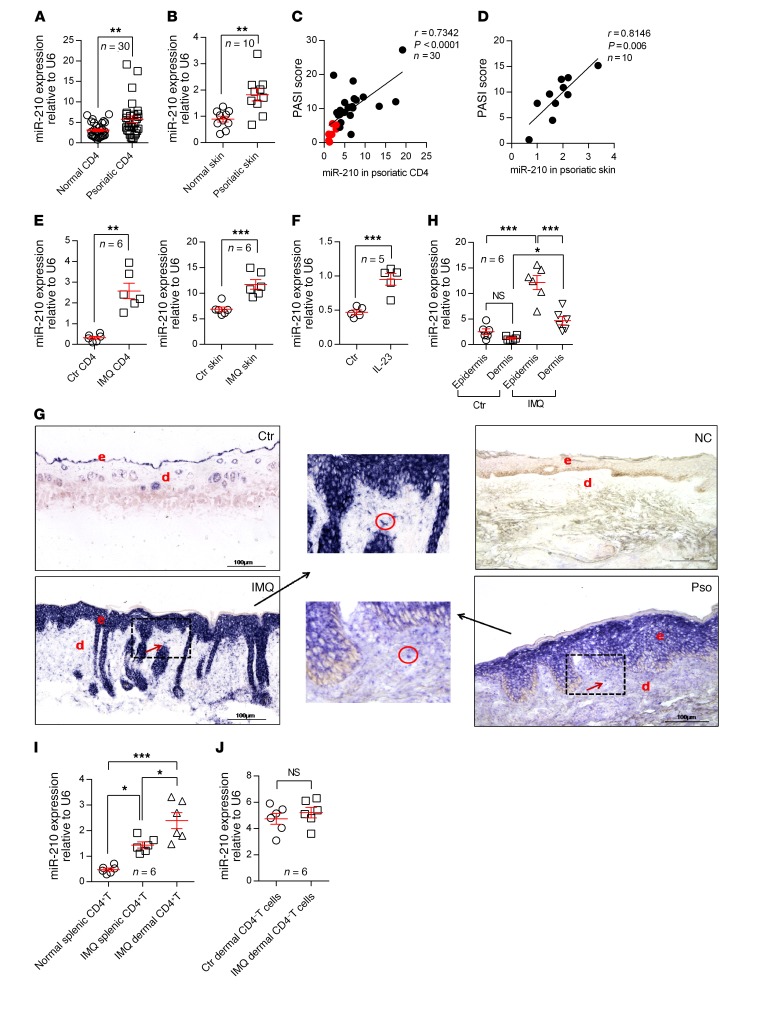
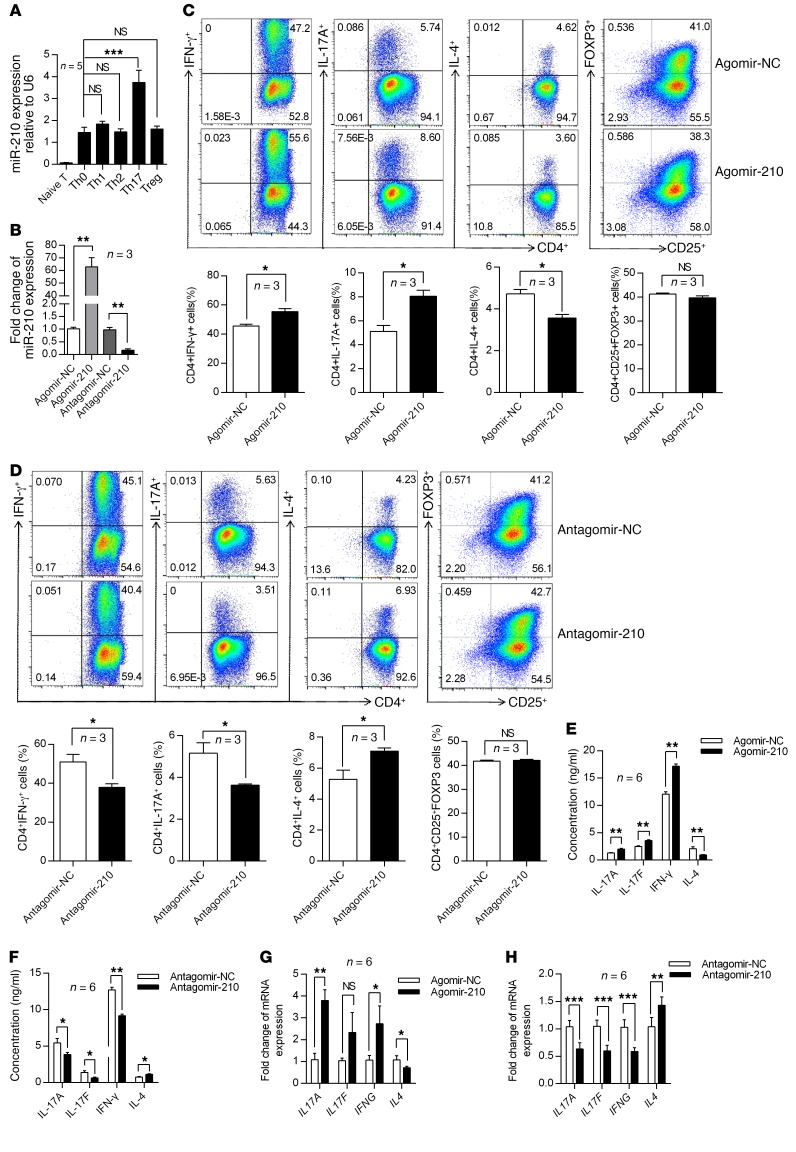
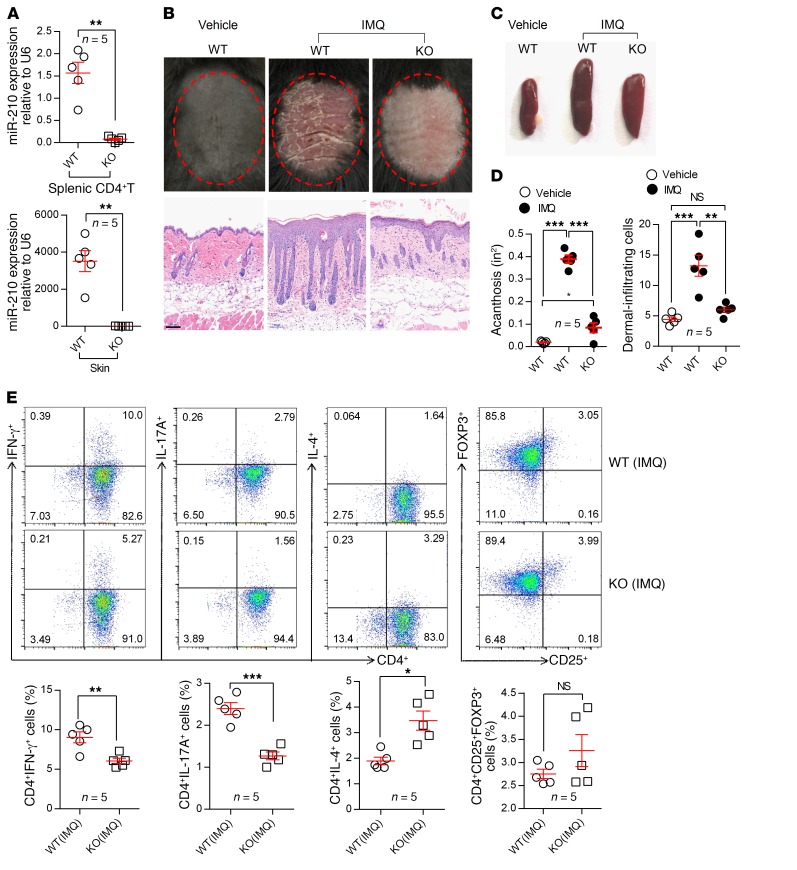
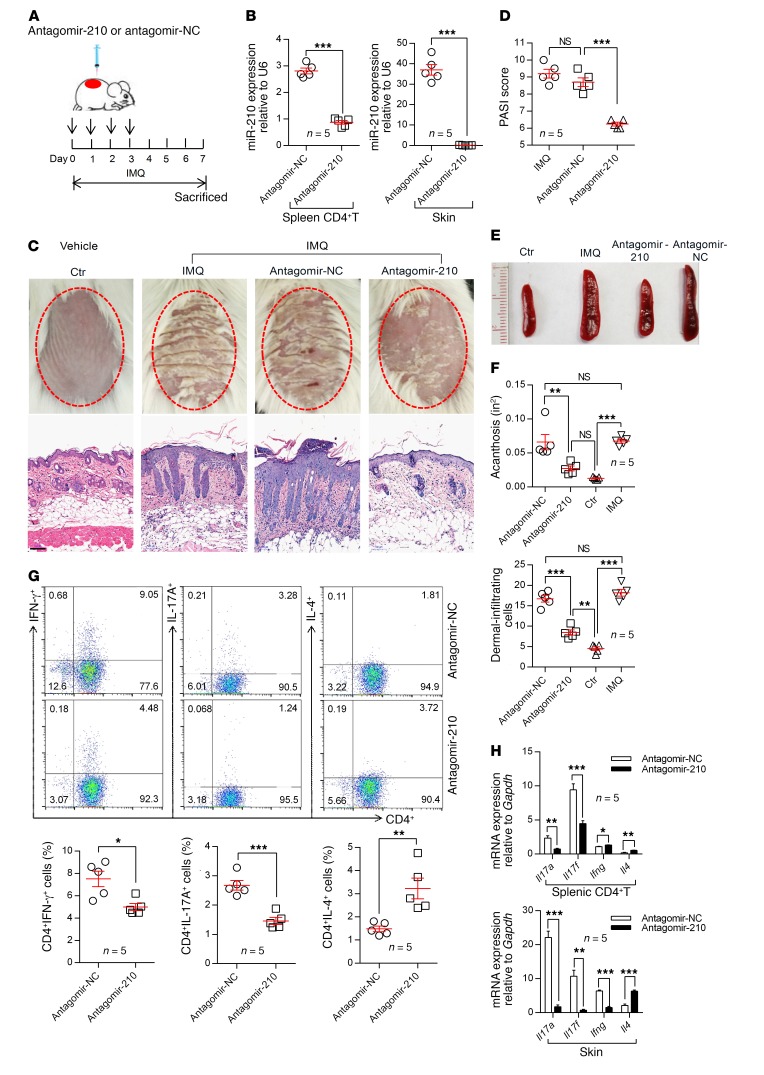
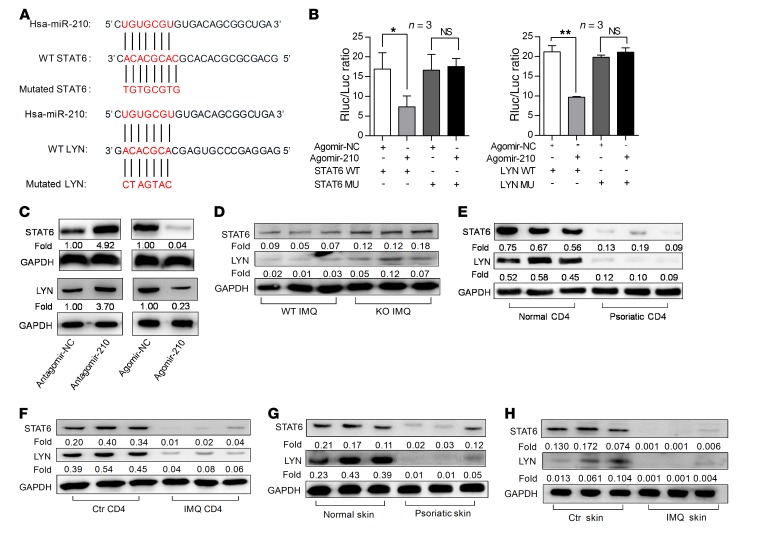
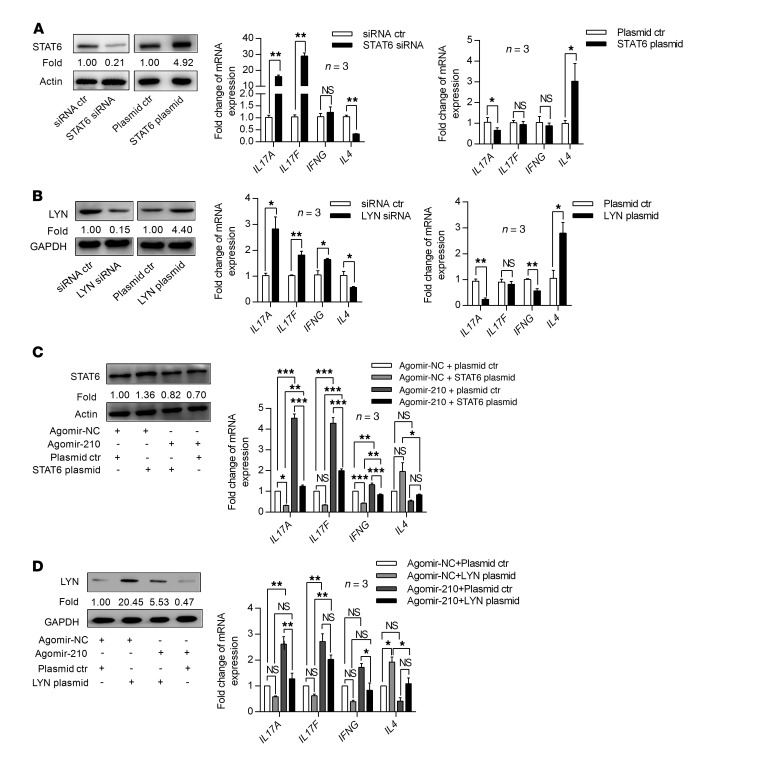
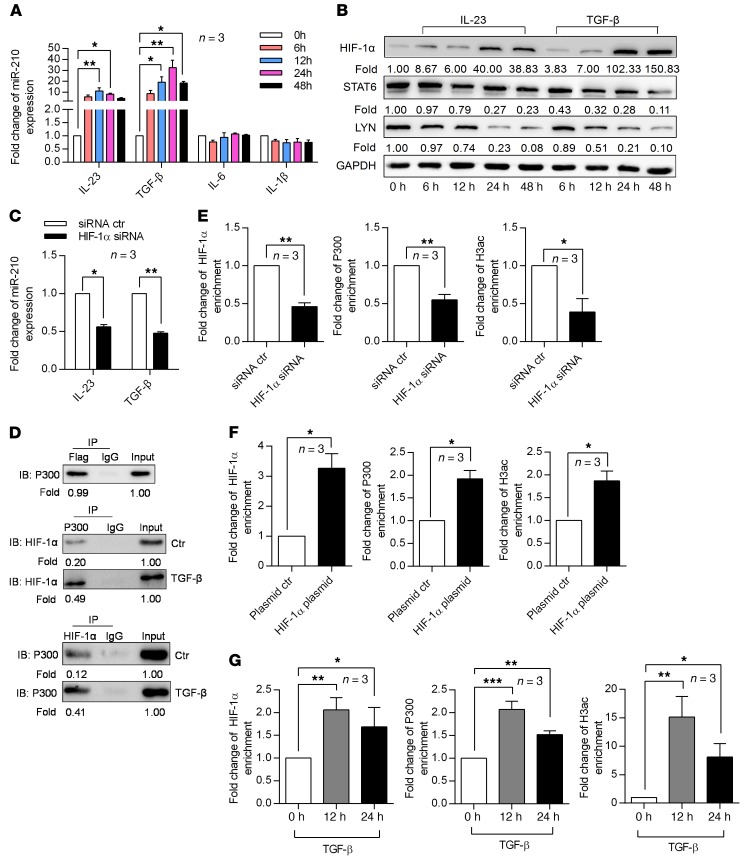
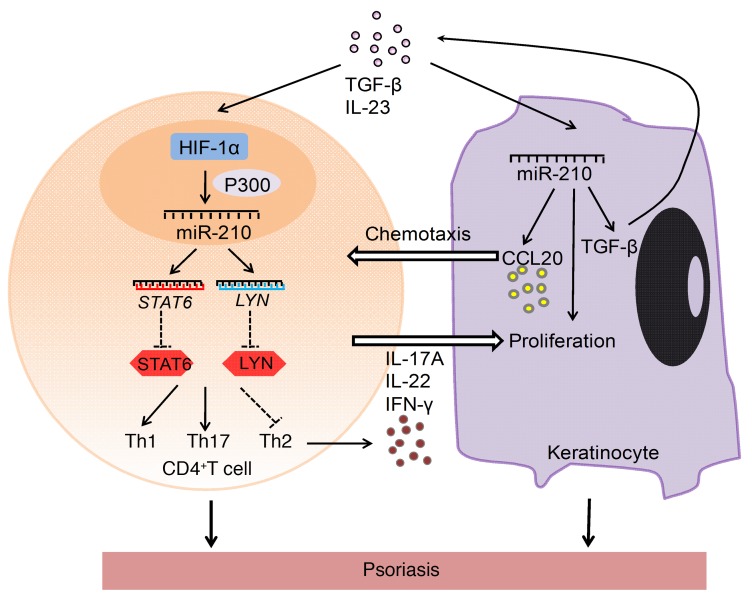
Immune imbalance of T lymphocyte subsets is a hallmark of psoriasis, but the molecular mechanisms underlying this aspect of psoriasis pathology are poorly understood. Here, we report that microRNA-210 (miR-210), a miR that is highly expressed in both psoriasis patients and mouse models, induces helper T (Th) 17 and Th1 cell differentiation but inhibits Th2 differentiation through repressing STAT6 and LYN expression, contributing to several aspects of the immune imbalance in psoriasis. Both miR-210 ablation in mice and inhibition of miR-210 by intradermal injection of antagomir-210 blocked the immune imbalance and the development of psoriasis-like inflammation in an imiquimod-induced or IL-23-induced psoriasis-like mouse model. We further showed that TGF-β and IL-23 enhance miR-210 expression by inducing HIF-1α, which recruits P300 and promotes histone H3 acetylation in the miR-210 promoter region. Our results reveal a crucial role for miR-210 in the immune imbalance of T lymphocyte subsets in psoriasis and suggest a potential therapeutic avenue.

Keywords: Autoimmune diseases; Autoimmunity; Dermatology; T cells.


Conflict of interest statement

Conflict of interest: The authors have declared that no conflict of interest exists.

Figures

Figure 1
Figure 1. miR-210 expression is elevated in psoriatic CD4+ T cells and skin lesions.
(A and B) Expression of miR-210 in CD4+ T cells (A, n = 30) and skin samples (B, n = 10) derived from psoriasis patients and healthy controls. (C and D) Correlation of human miR-210 expression in psoriatic CD4+ T cells (C, n = 30) or skin (D, n = 10) with PASI scores. (E) Expression of miR-210 in splenic CD4+ T cells (left panel) and skin samples (right panel) from untreated mice (n = 6) and IMQ-induced mice (n = 6). (F) Expression of miR-210 in skin lesions from normal ears (n = 5) and IL-23–treated ears (n = 5) of mice. (G) In situ hybridization was performed on mouse skin treated with vehicle (Ctr, n = 5) or IMQ (IMQ, n = 5) as well as human skin from healthy controls (NC, n = 6) and psoriasis patients (Pso, n = 5) using miR-210–specific LNA probes. Dark blue color indicates miR-210 expression. e, epidermis; d, dermis. Scale bars: 100 μm (lower magnification) and 50 μm (higher magnification). Red arrows indicate dermis-infiltrating inflammatory cells. (H) Expression of miR-210 in the epidermis and dermis of skin samples from untreated controls (n = 6) or IMQ-treated mice (n = 6). (I) miR-210 levels in CD4+ T cells derived from untreated mouse spleen (n = 6), IMQ-treated mouse spleen (n = 6), and IMQ-treated mouse lesional dermis (n = 6). (J) Expression of miR-210 in dermal CD4 T cells of skin samples from untreated controls (n = 6) or IMQ-treated mice (n = 6). Data are pooled from 2 independent experiments (AD) or are representative of 3 independent experiments (EJ) in BALB/c mice (E and GJ) and in C57BL/6J mice (F). Data represent the mean ± SEM. *P < 0.05, **P < 0.01, ***P < 0.001. Two-tailed Mann-Whitney U test (A and B), 2-tailed unpaired Student’s t test (E, F, and J), Spearman’s r test (C and D), or 1-way ANOVA with Bonferroni’s post hoc test (H and I) was used.
Figure 2
Figure 2. miR-210 contributes to the altered balance between pathogenic Th1/Th17 cells and Th2 cells in psoriasis.
(A) miR-210 expression in naive CD4+ T, Th0, Th1, Th2, Th17, and iTreg cells (n = 5). (B) miR-210 expression in CD4+ T cells transfected with agomir-210 (n = 3) or antagomir-210 (n = 3). (C and D) Human naive CD4+ T cells were transfected with agomir-210 (C, n = 3), antagomir-210 (D, n = 3), or their corresponding controls and then were differentiated into Th1, Th2, Th17, and iTreg cells. The percentage of Th1, Th2, Th17, and iTreg cells was detected by flow cytometry. Statistical analysis data are shown in the lower panel. (E and F) The protein levels of IL-17A, IL-17F, IFN-γ, and IL-4 in cultured supernatants from normal human CD4+ T cells transfected with agomir-210 or agomir-NC (E, n = 6) and psoriatic CD4+ T cells transfected with antagomir-210 or antagomir-NC (F, n = 6). (G and H) The mRNA levels of IL17A, IL17F, IFNG, and IL4 in normal human CD4+ T cells transfected with agomir-210 or agomir-NC (G, n = 6) and psoriatic CD4+ T cells transfected with antagomir-210 or antagomir-NC (H, n = 6). All experiments were performed in triplicate. Data represent the mean ± SEM. *P < 0.05, **P < 0.01, ***P < 0.001. NS, not significant. One-way ANOVA with Dunnett’s post hoc test (A) or 2-tailed unpaired Student’s t test (BH) was used.
Figure 3
Figure 3. miR-210 accelerates the development of psoriasis.
(A) Schematic diagram of intradermal administration of agomir-NC (5 nmol) or agomir-210 (5 nmol) on days 0, 1, 2, and 3 during the application of IMQ in mice (BALB/c). Three mice in each group were sacrificed on days 4, 7, 10, and 14 to conduct experiments. (B) Phenotypic presentation and H&E staining of lesional skin from mice injected with agomir-NC and agomir-210. Scale bars: 100 μm. (C) The miR-210 expression in splenic CD4+ T cells from agomir-NC–treated (n = 6) or agomir-210–treated mice (n = 6). (D) The size of spleens of mice in A. (E) PASI scores of mice in A (n = 6). (F and G) Acanthosis and dermal cellular infiltrates were quantified for mice treated with agomir-NC (n = 6) or agomir-210 (n = 6). For all measurements in G, the median number of specifically stained dermal nucleated cells was counted in 3 high-power fields per section. (H) The mRNA levels of Il17a, Il17f, Ifng, and Il4 in splenic CD4+ T cells from agomir-NC–treated (n = 3) or agomir-210–treated mice (n = 3). Data (DH) were obtained from agomir-NC– or agomir-210–treated mice on the seventh day. Data (BH) are representative of at least 3 independent experiments with 3 to 6 samples per group in each. Data represent the mean ± SEM. *P < 0.05, **P < 0.01, ***P < 0.001. NS, not significant. Two-tailed unpaired Student’s t test (C and EH) was used.
Figure 4
Figure 4. miR-210 deletion blocks psoriasis development.
(A) miR-210 expression in splenic CD4+ T cells (upper panel) or skin (lower panel) from KO (n = 5) and WT mice (n = 5). (B) Phenotypic presentation and H&E staining of mouse back skin for WT or KO mice treated with IMQ or vehicle for 7 days. Scale bars: 100 μm. (C and D) Splenomegaly (C), acanthosis (D, left panel), and dermal cellular infiltration (D, right panel) in WT or KO mice treated with IMQ (n = 5) or vehicle (n = 5) for 7 days. (E) Representative flow cytometric analysis of Th1, Th2, Th17, and Treg cells in splenic CD4+ T cells from WT (n = 5) or KO (n = 5) mice treated with IMQ for 7 days. Statistical data are shown in the right panel. All data are obtained from miR-210 KO or WT mice with C57BL/6J background and are representative of at least 3 independent experiments with 5 samples per group in each. Data represent the mean ± SEM. *P < 0.05, **P < 0.01, ***P < 0.001. NS, not significant. Two-tailed Mann-Whitney U test (A), 1-way ANOVA with Bonferroni’s post hoc test (D), or 2-tailed unpaired Student’s t test (E) was used.
Figure 5
Figure 5. Intradermal administration of antagomir-210 ameliorates the pathological phenotype of IMQ-induced psoriasis-like mice.
(A) Schematic diagram for intradermal administration of antagomir-NC (10 nmol) or antagomir-210 (10 nmol) on day 0, 1, 2, and 3 during the application of IMQ in BALB/c mice. (B) miR-210 expression in splenic CD4+ T cells (left panel) or skin lesions (right panel) from antagomir-NC–treated (n = 5) or antagomir-210–treated mice (n = 5). (C) The clinical manifestations and H&E staining of the back skin derived from mice injected with antagomir-NC or antagomir-210. Scale bars: 100 μm. (D) PASI score of mice in A (n = 5). (E) Splenomegaly of mice in A. (F) Acanthosis (upper panel) and dermal cellular infiltrates (lower panel) were quantified for control mice (n = 5) and IMQ-induced mice (n = 5) treated with antagomir-NC (n = 5) or antagomir-210 (n = 5). (G) Representative flow cytometric analysis of Th1, Th17, and Th2 cells in splenic CD4+ T cells from antagomir-NC–treated (n = 5) and antagomir-210–treated IMQ mice (n = 5). Statistical data are shown in the lower panel. (H) The mRNA expression of Il17a, Il17f, Ifng, and Il4 in splenic CD4+ T cells (upper panel) or skin lesions (lower panel) from mice treated with antagomir-NC (n = 5) or antagomir-210 (n = 5). All results are representative of at least 3 independent experiments with 3 to 5 samples per group in each. Data represent the mean ± SEM. *P < 0.05, **P < 0.01, ***P < 0.001. NS, not significant. Two-tailed unpaired Student’s t test (B, G, and H) or 1-way ANOVA with Bonferroni’s post hoc test (D and F) was used.
Figure 6
Figure 6. STAT6 and LYN are downstream targets of miR-210.
(A) miR-210 target sequences (in red) of the 3′-UTR of STAT6 (A, upper panel) and LYN (A, lower panel) mRNAs and corresponding mutant sequences, which were included in luciferase reporter vectors. (B) Luciferase activities were measured in HEK293T cells cotransfected with luciferase reporter vectors and agomir-210 or agomir-NC, n = 3 per group. (C) Normal CD4+ T cells were transfected with agomir-210 or agomir-NC, and psoriatic CD4+ T cells were transfected with antagomir-210 or antagomir-NC. STAT6 (upper panel) and LYN (lower panel) protein levels were analyzed. (D) The protein levels of STAT6 and LYN in splenic CD4+ T cells from IMQ-treated WT and KO mice. (EH) STAT6 and LYN protein levels in CD4+ T cells (E and F) and skin lesions (G and H) derived from psoriasis patients and IMQ-induced psoriasis-like mouse models (BALB/c) as well as their healthy controls. Data (B and C) are representative of at least 3 independent experiments. Data represent the mean ± SEM. *P < 0.05, **P < 0.01. NS, not significant. Two-tailed unpaired Student’s t test (B) was used.
Figure 7
Figure 7. STAT6 and LYN are required for miR-210–induced effects.
(A and B) Normal human CD4+ T cells were transfected with STAT6 siRNAs and overexpression plasmid (A, n = 3) or LYN siRNAs and overexpression plasmid (B, n = 3) separately for 48 hours. STAT6 and LYN protein levels (left panel), and the mRNA levels of IL17A, IL17F, IFNG, and IL4 (middle and right panels) were detected in transfected cells. (C and D) Normal human CD4+ T cells were transfected with agomir-210 or agomir-NC, and after 24 hours, the STAT6 overexpression plasmid or plasmid control (C, n = 3) and LYN overexpression plasmid or plasmid control (D, n = 3) were transfected into cells. Then, cells were collected to detect the protein levels of STAT6 or LYN (left panel) and the mRNA levels of IL17A, IL17F, IFNG, and IL4 (right panel) at 48 hours after transfection. Similar results were obtained from 3 independent experiments. Data represent the mean ± SEM. *P < 0.05, **P < 0.01, ***P < 0.001. NS, not significant. Two-tailed unpaired Student’s t test (A and B) or 1-way ANOVA with Bonferroni’s post hoc test (C and D) was used.
Figure 8
Figure 8. HIF-1α mediates TGF-β– and IL-23–induced miR-210 overexpression via epigenetic regulation.
(A and B) The expression of miR-210 in normal human CD4+ T cells stimulated with IL-23, TGF-β, IL-6, or IL-1β (A, n = 3 per group). The protein levels of HIF-1α, STAT6, and LYN in cells stimulated with IL-23 or TGF-β (B). (C) The miR-210 expression levels in human CD4+ T cells transfected with HIF-1α siRNA or siRNA controls followed by stimulation with IL-23 or TGF-β for 24 hours (n = 3 per group). (D) CD4+ T cells were transfected with HIF-1α overexpression plasmid (upper panel) or were stimulated with TGF-β (lower 2 panels). Co-IP and Western blot showed the interaction between HIF-1α and P300. (EG) The enrichment of HIF-1α, P300, and H3ac on the miR-210 promoter in psoriatic CD4+ T cells transfected with HIF-1α siRNA or controls (E, n = 3), normal CD4+ T cells transfected with HIF-1α plasmid or controls (F, n = 3), or normal CD4+ T cells stimulated with TGF-β (G, n = 3). Data (B and D) are representative of at least 3 independent experiments. Data represent the mean ± SEM. *P < 0.05, **P < 0.01, ***P < 0.001. One-way ANOVA with Dunnett’s post hoc test (A and G) or 2-tailed unpaired Student’s t test (C, E, and F) was used.
Figure 9
Figure 9. Schematic illustration of TGF-β/IL-23–HIF-1α–miR-210–STAT6/LYN pathways contributing to the pathogenesis of psoriasis.
In psoriasis patients, inflammatory factors TGF-β and IL-23 stimulate the expression of HIF-1α, which recruits P300 to the miR-210 promoter region and increases the H3ac levels on miR-210 promoters, thus leading to the upregulation of miR-210 expression. miR-210 represses STAT6 and LYN expression through binding the 3′-UTRs of STAT6 and LYN mRNA, which promotes Th1/Th17 cell differentiation and inhibits Th2 cell differentiation in psoriasis. Moreover, miR-210 overexpression also enhances the proliferation and chemokine secretion of keratinocytes, which increases the recruitment of activated T cells in skin lesions. Together, the effects of the increased miR-210 in CD4+ T cells and keratinocytes contribute to the formation of psoriatic skin lesions.

Similar articles

Cited by

References

    1. Nestle FO, Kaplan DH, Barker J. Psoriasis. N Engl J Med. 2009;361(5):496–509. doi: 10.1056/NEJMra0804595. - DOI - PubMed
    1. Mak RK, Hundhausen C, Nestle FO. Progress in understanding the immunopathogenesis of psoriasis. Actas Dermosifiliogr. 2009;100 Suppl 2:2–13. - PMC - PubMed
    1. Becher B, Pantelyushin S. Hiding under the skin: Interleukin-17-producing γδ T cells go under the skin? Nat Med. 2012;18(12):1748–1750. doi: 10.1038/nm.3016. - DOI - PubMed
    1. Gutcher I, Becher B. APC-derived cytokines and T cell polarization in autoimmune inflammation. J Clin Invest. 2007;117(5):1119–1127. doi: 10.1172/JCI31720. - DOI - PMC - PubMed
    1. Krueger JG. Hiding under the skin: A welcome surprise in psoriasis. Nat Med. 2012;18(12):1750–1751. doi: 10.1038/nm.3025. - DOI - PubMed

Publication types