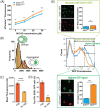
SOD1A4V aggregation alters ubiquitin homeostasis in a cell model of ALS
- PMID: 29748379
- PMCID: PMC6919637
- DOI: 10.1242/jcs.209122
SOD1A4V aggregation alters ubiquitin homeostasis in a cell model of ALS
Abstract
A hallmark of amyotrophic lateral sclerosis (ALS) pathology is the accumulation of ubiquitylated protein inclusions within motor neurons. Recent studies suggest the sequestration of ubiquitin (Ub) into inclusions reduces the availability of free Ub, which is essential for cellular function and survival. However, the dynamics of the Ub landscape in ALS have not yet been described. Here, we show that Ub homeostasis is altered in a cell model of ALS induced by expressing mutant SOD1 (SOD1A4V). By monitoring the distribution of Ub in cells expressing SOD1A4V, we show that Ub is present at the earliest stages of SOD1A4V aggregation, and that cells containing SOD1A4V aggregates have greater ubiquitin-proteasome system (UPS) dysfunction. Furthermore, SOD1A4V aggregation is associated with the redistribution of Ub and depletion of the free Ub pool. Ubiquitomics analysis indicates that expression of SOD1A4V is associated with a shift of Ub to a pool of supersaturated proteins, including those associated with oxidative phosphorylation and metabolism, corresponding with altered mitochondrial morphology and function. Taken together, these results suggest that misfolded SOD1 contributes to UPS dysfunction and that Ub homeostasis is an important target for monitoring pathological changes in ALS.This article has an associated First Person interview with the first author of the paper.
Keywords: ALS; Degron; Neurodegeneration; Proteasome; Protein aggregation; Proteostasis; SOD1; Supersaturation; Ubiquitin; Ubiquitomics.
© 2018. Published by The Company of Biologists Ltd.
Conflict of interest statement
Competing interestsThe authors declare no competing or financial interests.
Figures


Similar articles
-
ALS-linked CCNF variant disrupts motor neuron ubiquitin homeostasis.Hum Mol Genet. 2023 Jul 4;32(14):2386-2398. doi: 10.1093/hmg/ddad063. Hum Mol Genet. 2023. PMID: 37220877 Free PMC article.
-
Mutant Cu/Zn Superoxide Dismutase (A4V) Turnover Is Altered in Cells Containing Inclusions.Front Mol Neurosci. 2021 Nov 3;14:771911. doi: 10.3389/fnmol.2021.771911. eCollection 2021. Front Mol Neurosci. 2021. PMID: 34803609 Free PMC article.
-
Functional alterations of the ubiquitin-proteasome system in motor neurons of a mouse model of familial amyotrophic lateral sclerosis.Hum Mol Genet. 2009 Jan 1;18(1):82-96. doi: 10.1093/hmg/ddn319. Epub 2008 Sep 29. Hum Mol Genet. 2009. PMID: 18826962 Free PMC article.
-
Dysfunction of constitutive and inducible ubiquitin-proteasome system in amyotrophic lateral sclerosis: implication for protein aggregation and immune response.Prog Neurobiol. 2012 May;97(2):101-26. doi: 10.1016/j.pneurobio.2011.10.001. Epub 2011 Oct 20. Prog Neurobiol. 2012. PMID: 22033150 Review.
-
SOD1 in neurotoxicity and its controversial roles in SOD1 mutation-negative ALS.Adv Biol Regul. 2016 Jan;60:95-104. doi: 10.1016/j.jbior.2015.10.006. Epub 2015 Oct 31. Adv Biol Regul. 2016. PMID: 26563614 Review.
Cited by
-
Causative Links between Protein Aggregation and Oxidative Stress: A Review.Int J Mol Sci. 2019 Aug 9;20(16):3896. doi: 10.3390/ijms20163896. Int J Mol Sci. 2019. PMID: 31405050 Free PMC article. Review.
-
ALS-linked CCNF variant disrupts motor neuron ubiquitin homeostasis.Hum Mol Genet. 2023 Jul 4;32(14):2386-2398. doi: 10.1093/hmg/ddad063. Hum Mol Genet. 2023. PMID: 37220877 Free PMC article.
-
Tissue-selective regulation of protein homeostasis and unfolded protein response signalling in sporadic ALS.J Cell Mol Med. 2020 Jun;24(11):6055-6069. doi: 10.1111/jcmm.15170. Epub 2020 Apr 23. J Cell Mol Med. 2020. PMID: 32324341 Free PMC article.
-
Ubiquitin Homeostasis Is Disrupted in TDP-43 and FUS Cell Models of ALS.iScience. 2020 Oct 20;23(11):101700. doi: 10.1016/j.isci.2020.101700. eCollection 2020 Nov 20. iScience. 2020. PMID: 33196025 Free PMC article.
-
Axonopathy Underlying Amyotrophic Lateral Sclerosis: Unraveling Complex Pathways and Therapeutic Insights.Neurosci Bull. 2024 Nov;40(11):1789-1810. doi: 10.1007/s12264-024-01267-2. Epub 2024 Aug 4. Neurosci Bull. 2024. PMID: 39097850 Review.
References
-
- Bergink S., Salomons F. A., Hoogstraten D., Groothuis T. A., de Waard H., Wu J., Yuan L., Citterio E., Houtsmuller A. B., Neefjes J. et al. (2006). DNA damage triggers nucleotide excision repair-dependent monoubiquitylation of histone H2A. Genes Dev. 20, 1343-1352. 10.1101/gad.373706 - DOI - PMC - PubMed
-
- Boeynaems S., Bogaert E., Kovacs D., Konijnenberg A., Timmerman E., Volkov A., Guharoy M., De Decker M., Jaspers T., Ryan V. H. et al. (2017). Phase separation of C9orf72 dipeptide repeats perturbs stress granule dynamics. Mol. Cell 65, 1044-1055 e5. 10.1016/j.molcel.2017.02.013 - DOI - PMC - PubMed
-
- Brettschneider J., Arai K., Del Tredici K., Toledo J. B., Robinson J. L., Lee E. B., Kuwabara S., Shibuya K., Irwin D. J., Fang L. et al. (2014). TDP-43 pathology and neuronal loss in amyotrophic lateral sclerosis spinal cord. Acta Neuropathol. 128, 423-437. 10.1007/s00401-014-1299-6 - DOI - PMC - PubMed
Publication types
MeSH terms
Substances
Grants and funding
LinkOut - more resources
Full Text Sources
Other Literature Sources
Medical
Research Materials
Miscellaneous

