

Blockade of ITGA2 Induces Apoptosis and Inhibits Cell Migration in Gastric Cancer
- PMID: 29743821
- PMCID: PMC5928594
- DOI: 10.1186/s12575-018-0073-x
Blockade of ITGA2 Induces Apoptosis and Inhibits Cell Migration in Gastric Cancer
Abstract
Background: Gastric cancer is currently the fourth leading cause of cancer-related death worldwide. Gastric cancer is often diagnosed at advanced stages and the outcome of the treatment is often poor. Therefore, identifying new therapeutic targets for this cancer is urgently needed. Integrin alpha 2 (ITGA2) subunit and the beta 1 subunit form a heterodimer for a transmembrane receptor for extracellular matrix, is an important molecule involved in tumor cell proliferation, survival and migration. Integrin α2β1 is over-expressed on a variety of cancer cells, but is low or absent in most normal organs and resting endothelial cells.
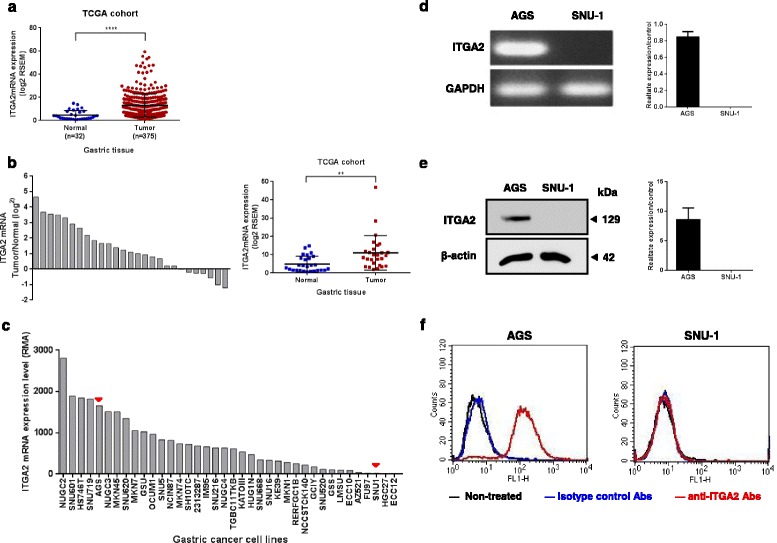
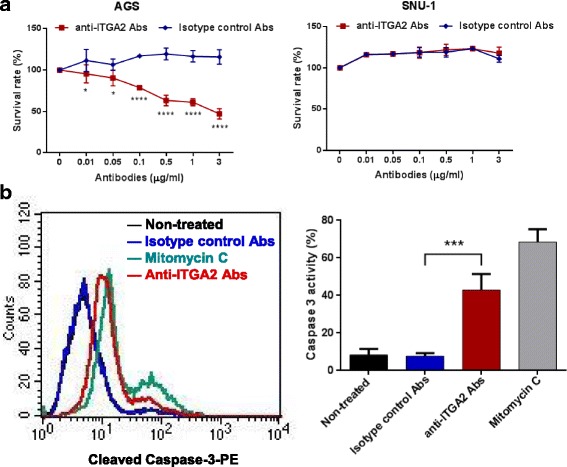
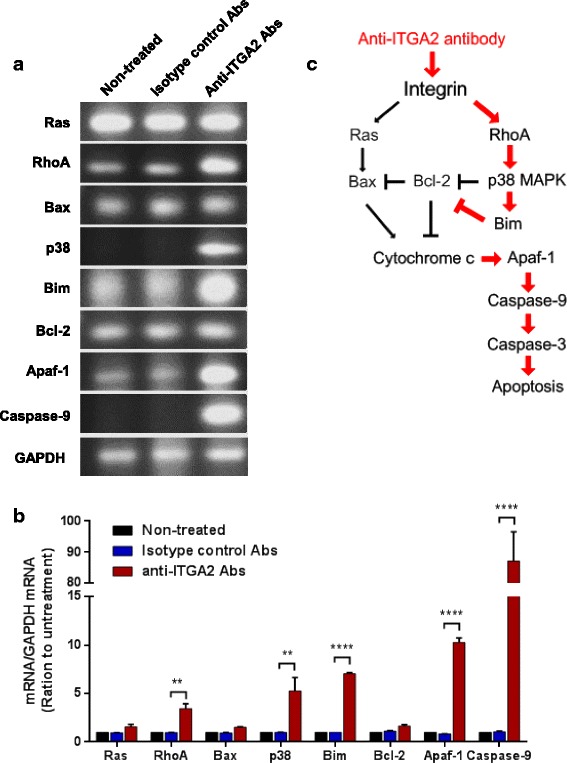
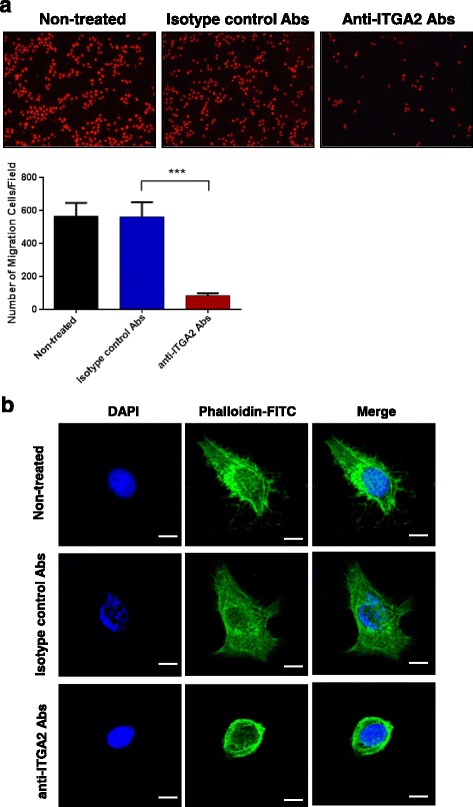
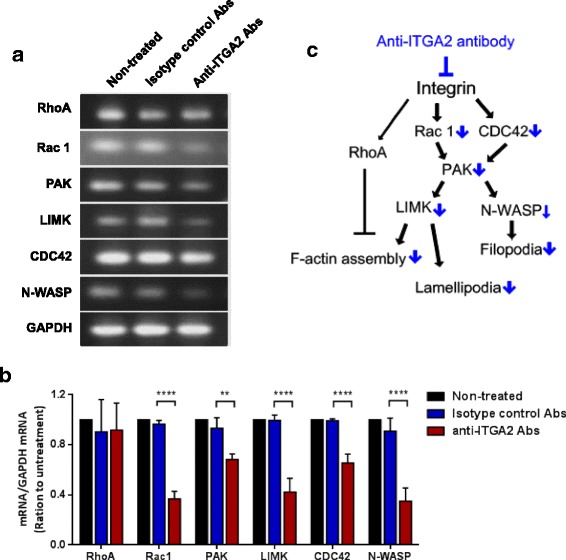
Results: In this report, we assessed the ITGA2 as the potential therapeutic target with the bioinformatics tools from the TCGA dataset in which composed of 375 gastric cancer tissues and 32 gastric normal tissues. According to the information from the Cancer Cell Line Encyclopedia (CCLE) database, the AGS cell line with ITGA2 high expression and the SUN-1 cell line with low expression were chosen for the further investigation. Interestingly, the anti-ITGA2 antibody (at 3 μg/ml) inhibited approximately 50% survival of the AGS cells (over-expressed ITGA2), but had no effect in SNU-1 cells (ITGA2 negative). The extents of antibody-mediated cancer inhibition positively correlated with the expression levels of the ITGA2. We further showed that the anti-ITGA2 antibody induced apoptosis by up-regulating the RhoA-p38 MAPK signaling to promote the expressions of Bim, Apaf-1 and Caspase-9, whereas the expressions of Ras and Bax/Bcl-2 were not affected. Moreover, blocking ITGA2 by the specific antibody at lower doses also inhibited cell migration of gastric cancer cells. Blockade of ITGA2 by a specific antibody down-regulated the expression of N-WASP, PAK and LIMK to impede actin organization and cell migration of gastric cancer cells.
Conclusions: Here, we showed that the mRNA expression levels of ITGA2 comparing to normal tissues significantly increased. In addition, the results revealed that targeting integrin alpha 2 subunit by antibodies did not only inhibit cell migration, but also induce apoptosis effect on gastric cancer cells. Interestingly, higher expression level of ITGA2 led to significant effects on apoptosis progression during anti-ITGA2 antibody treatment, which indicated that ITGA2 expression levels directly correlate with their functionality. Our findings suggest that ITGA2 is a potential therapeutic target for gastric cancer.
Keywords: Apoptosis; Cell migration; Gastric cancer; ITGA2; Integrin alpha-2; Proliferation; Therapeutic target.
Conflict of interest statement
Not applicable.Not applicable.The authors declare that they have no competing interests.Springer Nature remains neutral with regard to jurisdictional claims in published maps and institutional affiliations.
Figures
Similar articles
-
Ropivacaine inhibits proliferation, invasion, migration and promotes apoptosis of papillary thyroid cancer cells via regulating ITGA2 expression.Drug Dev Res. 2020 Sep;81(6):700-707. doi: 10.1002/ddr.21671. Epub 2020 Apr 20. Drug Dev Res. 2020. PMID: 32314406
-
Regulation of Integrin Subunit Alpha 2 by miR-135b-5p Modulates Chemoresistance in Gastric Cancer.Front Oncol. 2020 Mar 13;10:308. doi: 10.3389/fonc.2020.00308. eCollection 2020. Front Oncol. 2020. PMID: 32232000 Free PMC article.
-
Coexpression of UCA1 and ITGA2 in pancreatic cancer cells target the expression of miR-107 through focal adhesion pathway.J Cell Physiol. 2019 Aug;234(8):12884-12896. doi: 10.1002/jcp.27953. Epub 2018 Dec 19. J Cell Physiol. 2019. PMID: 30569514
-
ITGA2, LAMB3, and LAMC2 may be the potential therapeutic targets in pancreatic ductal adenocarcinoma: an integrated bioinformatics analysis.Sci Rep. 2021 May 18;11(1):10563. doi: 10.1038/s41598-021-90077-x. Sci Rep. 2021. PMID: 34007003 Free PMC article.
-
Overexpressed ITGA2 promotes malignant tumor aggression by up-regulating PD-L1 expression through the activation of the STAT3 signaling pathway.J Exp Clin Cancer Res. 2019 Dec 9;38(1):485. doi: 10.1186/s13046-019-1496-1. J Exp Clin Cancer Res. 2019. PMID: 31818309 Free PMC article.
Cited by
-
Exosomes-Mediated Transfer of Itga2 Promotes Migration and Invasion of Prostate Cancer Cells by Inducing Epithelial-Mesenchymal Transition.Cancers (Basel). 2020 Aug 15;12(8):2300. doi: 10.3390/cancers12082300. Cancers (Basel). 2020. PMID: 32824235 Free PMC article.
-
THBS4 predicts poor outcomes and promotes proliferation and metastasis in gastric cancer.J Physiol Biochem. 2019 Feb;75(1):117-123. doi: 10.1007/s13105-019-00665-9. Epub 2019 Feb 12. J Physiol Biochem. 2019. PMID: 30746617
-
Targeting integrin α2 as potential strategy for radiochemosensitization of glioblastoma.Neuro Oncol. 2023 Apr 6;25(4):648-661. doi: 10.1093/neuonc/noac237. Neuro Oncol. 2023. PMID: 36219689 Free PMC article.
-
Identification of hub genes with diagnostic values in pancreatic cancer by bioinformatics analyses and supervised learning methods.World J Surg Oncol. 2018 Nov 14;16(1):223. doi: 10.1186/s12957-018-1519-y. World J Surg Oncol. 2018. PMID: 30428899 Free PMC article.
-
Diagnostic and prognostic values of integrin α subfamily mRNA expression in colon adenocarcinoma.Oncol Rep. 2019 Sep;42(3):923-936. doi: 10.3892/or.2019.7216. Epub 2019 Jun 28. Oncol Rep. 2019. PMID: 31322253 Free PMC article.
References
-
- Ferlay J, Soerjomataram I, Ervik M, Dikshit R, Eser S, Mathers C, Rebelo M, Parkin D, Forman D, Bray F. GLOBOCAN 2012 v1. 0, cancer incidence and mortality worldwide: IARC CancerBase no. 11 [internet]. 2013. International Agency for Research on Cancer.globocan iarc fr/Default aspx: Lyon, France; 2014.
-
- Bria E, De Manzoni G, Beghelli S, Tomezzoli A, Barbi S, Di Gregorio C, Scardoni M, Amato E, Frizziero M, Sperduti I, et al. A clinical-biological risk stratification model for resected gastric cancer: prognostic impact of Her2, Fhit, and APC expression status. Ann Oncol. 2013;24:693–701. doi: 10.1093/annonc/mds506. - DOI - PubMed
-
- Yamamoto H, Watanabe Y, Maehata T, Morita R, Yoshida Y, Oikawa R, Ishigooka S, Ozawa S, Matsuo Y, Hosoya K, et al. An updated review of gastric cancer in the next-generation sequencing era: insights from bench to bedside and vice versa. World J Gastroenterol. 2014;20:3927–3937. doi: 10.3748/wjg.v20.i14.3927. - DOI - PMC - PubMed
LinkOut - more resources
Full Text Sources
Other Literature Sources
Research Materials
Miscellaneous
