. 2018 May 3;3(9):e98380.
doi: 10.1172/jci.insight.98380.

pDCs in lung and skin fibrosis in a bleomycin-induced model and patients with systemic sclerosis

Affiliations

pDCs in lung and skin fibrosis in a bleomycin-induced model and patients with systemic sclerosis

Suzanne Kafaja et al. JCI Insight. .

Abstract

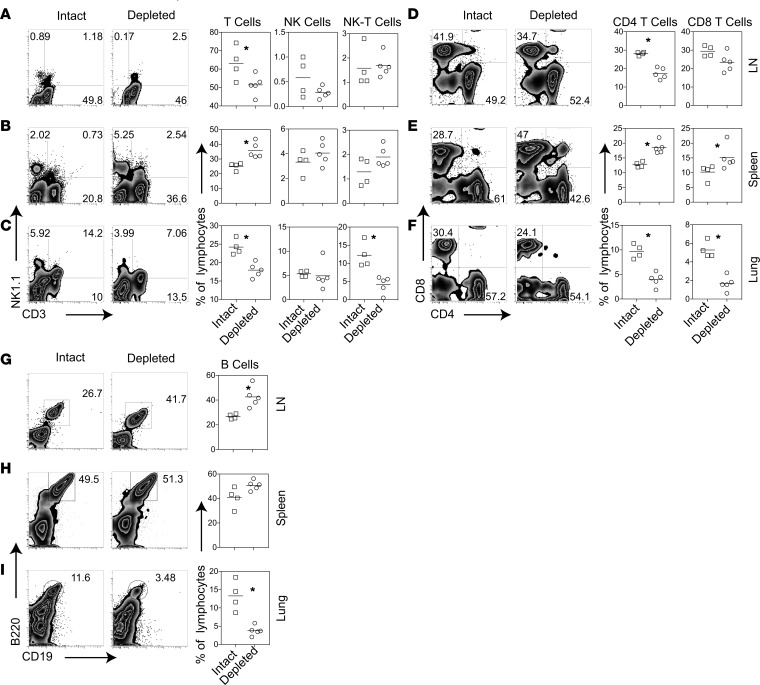
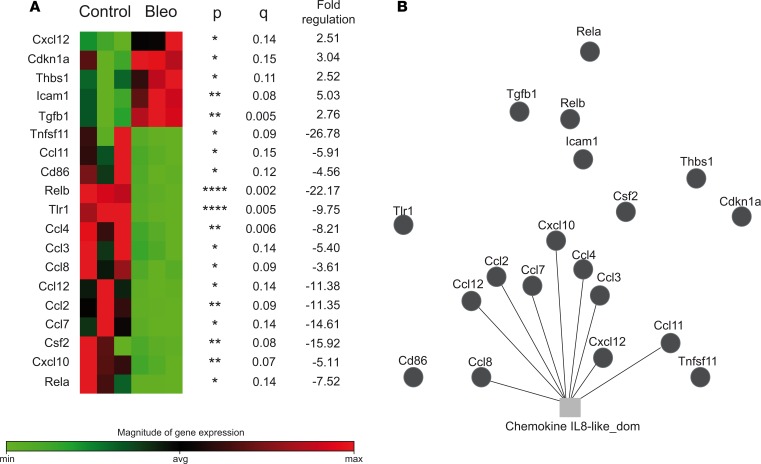
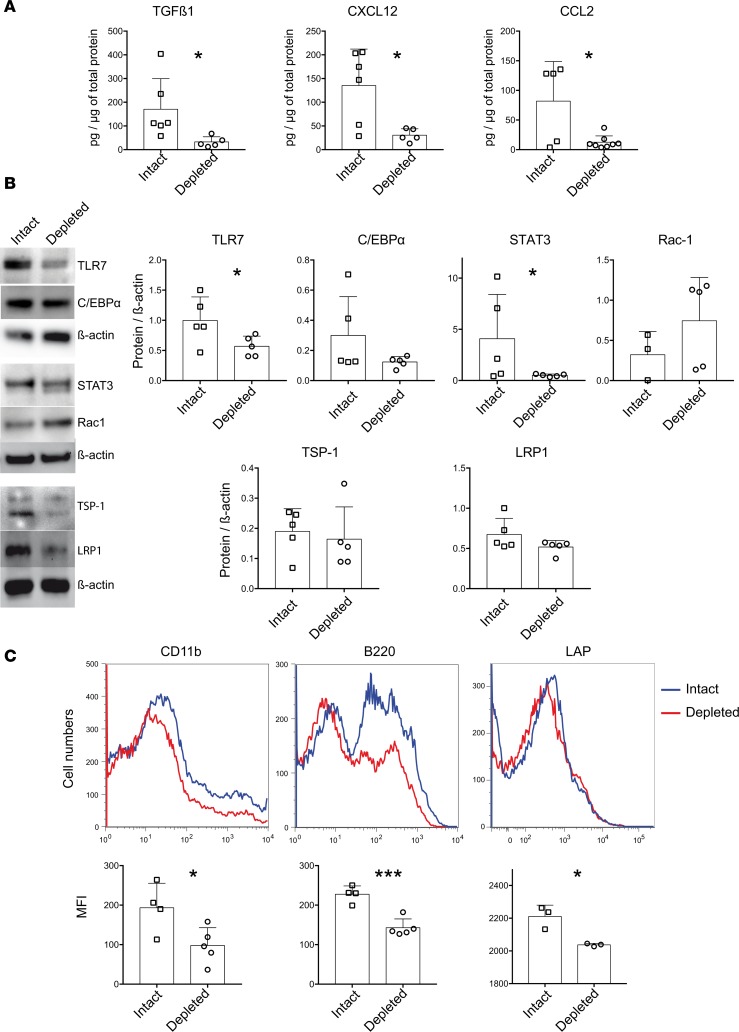
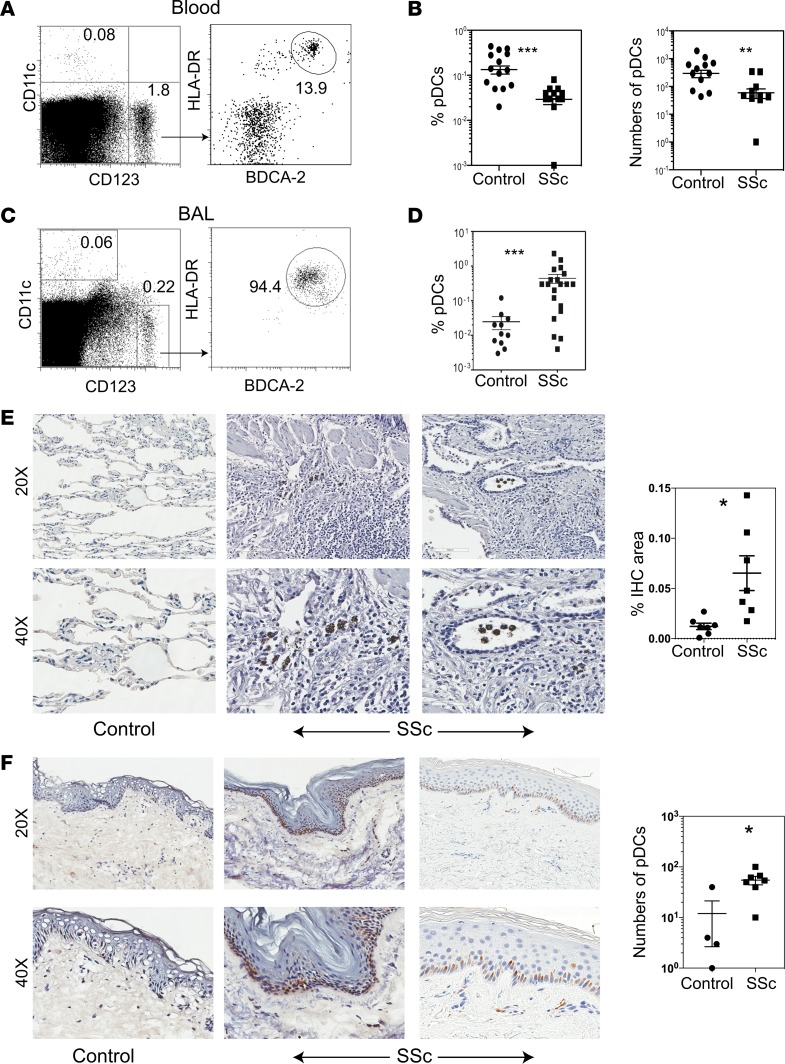
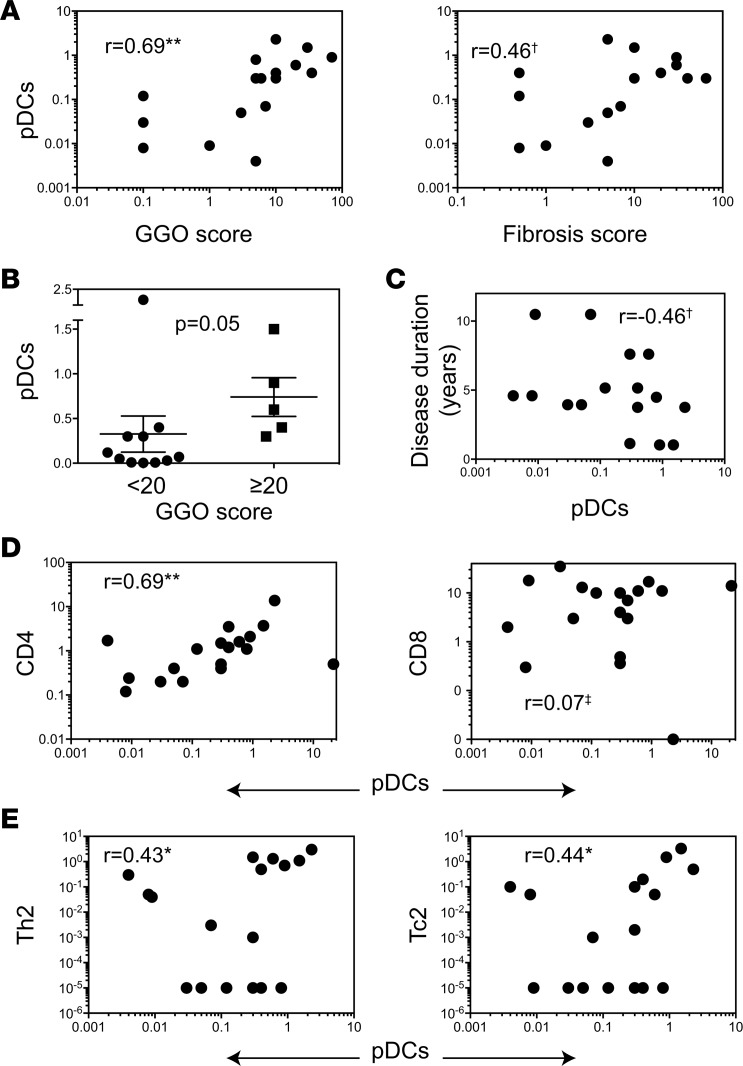
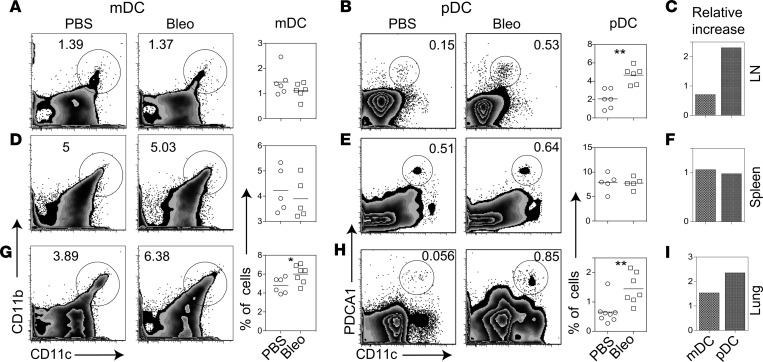
Fibrosis is the end result of most inflammatory conditions, but its pathogenesis remains unclear. We demonstrate that, in animals and humans with systemic fibrosis, plasmacytoid DCs (pDCs) are unaffected or are reduced systemically (spleen/peripheral blood), but they increase in the affected organs (lungs/skin/bronchoalveolar lavage). A pivotal role of pDCs was shown by depleting them in vivo, which ameliorated skin and/or lung fibrosis, reduced immune cell infiltration in the affected organs but not in spleen, and reduced the expression of genes and proteins implicated in chemotaxis, inflammation, and fibrosis in the affected organs of animals with bleomycin-induced fibrosis. As with animal findings, the frequency of pDCs in the lungs of patients with systemic sclerosis correlated with the severity of lung disease and with the frequency of CD4+ and IL-4+ T cells in the lung. Finally, treatment with imatinib that has been reported to reduce and/or prevent deterioration of skin and lung fibrosis profoundly reduced pDCs in lungs but not in peripheral blood of patients with systemic sclerosis. These observations suggest a role for pDCs in the pathogenesis of systemic fibrosis and identify the increased trafficking of pDCs to the affected organs as a potential therapeutic target in fibrotic diseases.

Keywords: Autoimmune diseases; Fibrosis; Inflammation; Pulmonology; Rheumatology.


Conflict of interest statement

Conflict of interest: The authors have declared that no conflict of interest exists.

Figures

Figure 2
Figure 2. Effect of depletion of pDCs on skin and lung disease in bleomycin-injected animals.
Animals were injected with PBS or bleomycin (Bleo), and bleomycin-injected animals treated with PBS, an isotype-matched control Ab (Intact), or an anti–PDCA-1 Ab (Depleted), as described in Supplemental Figure 2A. Animals were monitored for general health and skin lesions, and organs were harvested on day 28. (A) Representative photographs illustrate clinical features, including the hunched back appearance (h), submandibular erythema (e), piloerection (p), and alopecia (a), in bleomycin-injected mice. None of the PBS-injected mice had these lesions. (B and C) Each of the aforementioned features were given a score of 1, as described in Methods, and clinical severity scores derived for individual animals (n = 9, 9, 22, and 19 animals in PBS, bleomycin alone, bleomycin + control Ab, and bleomycin + anti–PDCA-1 Ab groups, respectively). (D–F) Lung sections stained with H&E were scored for the severity of lung disease. Representative photomicrographs and histology scores are shown (magnification, 10×). (G and H) Skin sections stained with H&E were analyzed for dermal thickness, as indicated by arrows in the representative photomicrographs (magnification, 4×). Results are shown as symbol plots, each symbol representing an animal, and/or as stack plots. Horizontal lines on symbol plots represent mean values. Each stack on stack plots represents proportion of animals with a clinical or histology score, as indicated by the legend on the right of panels. *P < 0.05, **P < 0.01, ***P <0.001 (1-way ANOVA with Newman-Keuls multiple comparisons test in B, E, and H; χ2 test with Yates correction in C and F).
Figure 3
Figure 3. Effect of depletion of pDCs on measures of fibrosis in bleomycin-injected animals.
Animals were injected with PBS or bleomycin (Bleo), and bleomycin-injected animals treated with PBS, an isotype-matched control Ab (Intact), or an anti–PDCA-1 Ab (Depleted), as described in Supplemental Figure 2A. Lung (left columns) and skin (right columns) tissues harvested on day 28 were stained with Masson’s trichrome (A and B), as well as Picrosirius red stain imaged in parallel light to display total collagen content (C and D) or orthogonal light to display fibrillar collagen (E and F). Results are expressed as representative photomicrographs (n = more than 8 each of intact and depleted animals in A and B, and 5 each in C–F). Magnification, 10× for the lung and 4× for the skin. Photomicrographs below E and F show magnified views of insets in these panels. Magnification, 200× and 20×, respectively. (G and H) Total soluble collagen content in the lung and skin was measured using the Sircol assay. Results are shown as collagen levels per 100 μg of total protein in the tissue. Each symbol represents an animal. Horizontal lines denote mean values. *P < 0.05, 1-way ANOVA with Newman-Keuls multiple comparisons test.
Figure 4
Figure 4. Effect of depletion of pDCs on immune cell subsets in the lung-draining lymph nodes, spleen, and lung.
(AI) Animals were injected with bleomycin and treated with an anti–PDCA-1 Ab (Depleted) or an isotype-matched control Ab (Intact), as described in Supplemental Figure 2A. Lung-draining lymph nodes (LN), spleen, and lungs were harvested on day 28 and analyzed for immune cell subsets. Numbers on representative FACS plots represent the % of positive cells in the lymphocyte gate; (AC, and GI) or in the TCRβ+ cell gate (D-F) dots in symbol plots represent individual animals. Small horizontal lines indicate average values. Results shown are representative of 5 independent experiments, each using 4–5 animals per group. *P < 0.05, Mann-Whitney U test.
Figure 5
Figure 5. Effect of bleomycin on the expression of genes related to DC and antigen presenting cell function.
Lung tissues from PBS- (Control) and bleomycin-injected (Bleo) mice were profiled using the Mouse Dendritic and Antigen Presenting Cell RT2 Profiler PCR Array (Supplemental Figure 11). Fold changes were calculated and expressed as the log-normalized ratios of the bleomycin/control groups. For multiple comparisons, we applied a FDR approach using 2-stage linear step-up procedure of Benjamini, Krieger, and Yekutieli, with a q of 15%. Results of differentially expressed genes with their P values, q values, and fold-changes are shown. *P < 0.05, **P < 0.01, ****P < 0.0001 (A). (B) Gene function network analysis of differentially expressed genes was performed using GeneMANIA (51) (Supplemental Figure 5).
Figure 6
Figure 6. Effect of pDC depletion on the expression of genes related to DC and antigen presenting cell function in bleomycin-injected mice.
Lung (A) and skin (B) tissues from pDC-depleted and intact bleomycin-injected mice were profiled using the Mouse Dendritic and Antigen Presenting Cell RT2 Profiler PCR Array (Supplemental Figure 12). Multiple 2-tailed t test and FDR analysis was performed using the corrected method of Benjamini and Yekutieli with a desired FDR (q) of 10%. Fold changes of the differentially expressed genes and P and q values are presented on the right of heatmaps. In the lungs, 40 genes were differentially expressed between pDC-intact and -depleted mice, of which 33 genes were significantly reduced and 7 were increased in pDC-depleted animals as compared with pDC-intact animals. In the skin, 9 genes were differentially expressed between pDC-intact and -depleted mice, of which 5 genes were significantly reduced and 4 genes were increased in pDC-depleted animals as compared with pDC-intact mice. Results represent 2 experiments. *P < 0.05; **P < 0.01, ***P < 0.001, ****P < 0.0001 (n = 4 pDC-depleted and 3 intact mice).
Figure 7
Figure 7. Effect of pDC depletion on protein levels for selected differentially expressed genes in bleomycin-injected mice.
Protein extracts or freshly isolated cells from the lungs of pDC-depleted and-intact bleomycin-injected mice were profiled for proteins for 10 downregulated genes and 1 upregulated gene (Rac1), as shown in Figure 6. (A) Levels of TGFβ1, CXCL12, and CCR2 ligand (CCL2) were measured by ELISA. (B) Expression levels of TLR7, C/EBPα, STAT3, Rac-1, thrombospondin-1 (TSP-1, Thbs1 gene), and LRP1 were assayed by Western blot. (C) Surface expression of CD11b (for Itgam), B220 (for Ptprc), and LAP (latency associated peptide) for latent TGFβ was detected by flow cytometry. Results are expressed as representative Western blot and flow cytometry plots, symbol plots with each symbol representing an animal, and as the mean ± SEM values. MFI, mean fluorescent intensity. *P < 0.05, ***P < 0.001 (unpaired 2-tailed t test).
Figure 8
Figure 8. Detection of pDCs in the peripheral blood, BAL, and lung and skin tissues from patients with SSc and controls.
(A and B) Peripheral blood mononuclear cells from 15 each of healthy controls and patients with SSc were analyzed by flow cytometry for CD11c, CD123, HLA-DR, and BDCA-2 expression. Representative dot plots show CD11cCD123+ cells that were further analyzed for HLA-DR+BDCA-2+ cells, which are expressed as % of gated CD11cCD123+ cells on dot plots (A). The percentage (expressed as the % of CD123+CD11cHLA-DR+BDCA-2+ cells of total blood cells) and total number of peripheral blood pDCs were compared between healthy controls and SSc patients (B). Data are shown as individual sample values and as the mean ± SEM. **P < 0.01 and ***P < 0.001 (unpaired 2-tailed t test). (C and D) BAL cells from SSc-ILD patients before enrollment into the imatinib trial were analyzed by flow cytometry for CD11c, CD123, HLA-DR, and BDCA-2. Representative dot plots from SSc patients show CD11cCD123+ cells that were further analyzed for HLA-DR+BDCA-2+ cells (C). BAL samples from patients who had bronchoscopy for respiratory symptoms but not found to have any significant lung disease on further evaluations were used as controls. The percentage of BAL pDCs were compared between SSc-ILD patients and controls (D). pDCs are expressed as the % of CD123+CD11cHLA-DR+BDCA-2+ cells of total BAL cells (mean ± SEM; ***P < 0.001, unpaired t-test). (E) Paraffin-embedded sections (4 μm) of lung tissues were obtained from SSc-lung explants and control lungs (wedge resection for spontaneous pneumothorax or traumatic lung laceration or lungs collected at autopsy from cases with renal cancer or liver cirrhosis). The sections were stained with anti–BDCA-2 Ab to detect pDCs. While the control lungs had no to a few BDCA-2+ cells (left panels), all SSc lungs show BDCA-2+ cells in the interstitial tissue (middle and right panels) and bronchi (right panels). Stained sections were digitized using the Aperio scanning system. Results from individual subjects are expressed in a symbol plot as the percent IHC-stained area (mean ± SEM; *P = 0.01, unpaired 2-tailed t test). (F) Frozen sections (6 μm) of 6-mm punch skin biopsies from patients with 4 SSc and 2 healthy volunteers were stained for BDCA-2. Similar results were obtained in a separate experiment using paraffin-embedded skin sections from 4 each of SSc patients and healthy volunteers. Representative photomicrographs show no to rare BDCA-2+ cells in control skin (left panels), but abundant BDCA-2+ cells in the epidermis and dermis of 2 SSc patients: a 41-year-old man with an mRSS of 33 (middle panels) and a 21-year-old woman with an mRSS of 25 (right panels). The stained cells were manually counted, and the results from individual subjects are shown in a symbol plot as the number of pDCs per mm3 (mean ± SEM; *P = 0.01, unpaired 2-tailed t test).
Figure 9
Figure 9. Correlation between disease parameters and pDCs in patients with SSc.
The frequencies of pDCs in BAL samples were correlated with: (A) HRCT scores of GGO and fibrosis, (C) with disease duration of SSc, (D) with the frequencies of T cell subsets, and (E) with the frequencies of IL-4–producing CD4+ and CD4 cells (referred to as Th2 and Tc2, respectively) in the BAL from SSc patients. Cell subsets are expressed as the frequencies of total cells in the BAL. r values from nonparametric Spearman correlations are indicated on plots. **P < 0.01, *P < 0.05, P = 0.05–0.09, and P > 0.1. (B) The pDC frequencies in SSc patients with low (<20%, n = 13) vs. high (≥20%, n = 5) GGO scores (mean ± SEM; P = 0.05, Mann-Whitney U test).
Figure 10
Figure 10. Effect of treatment with imatinib on pDCs in peripheral blood and BAL in patients with SSc.
Frequencies of pDCs in blood and BAL were compared at baseline and 1 year after imatinib. Each line represents values from a single patient. Pre, baseline; Post, after imatinib. **P = 0.004, Wilcoxon signed-rank test.
Figure 1
Figure 1. Effect of s.c. bleomycin on DCs in the lung-draining lymph nodes, spleen, and lung.
(A, B, D, E, G, and H)Animals were injected s.c. with bleomycin (Bleo) or PBS daily for 2 weeks. Twenty-eight days after the first injection, mediastinal lymph nodes (LN), spleen, and lungs were harvested. Their single cell suspension were analyzed for pDCs and mDCs. Numbers on FACS plots represent the percentage of gated cells: CD11cintPDCA-1+ cells as % of live SSclowFSClow cells (lymphocyte gate) for pDCs, and CD11b+CD11c+ cells as % of all live cells (autofluorescent cells excluded) for mDCs. Results are expressed as representative FACS plots and as symbol plots, where each symbol represents a single animal. Horizontal lines denote mean. C, F, and I show a relative increase (ratio) in mDCs and pDCs in bleomycin-injected mice as compared with PBS-injected mice. Results shown are representative of 3 independent experiments. *P < 0.05; **P < 0.01, Mann-Whitney U test.

Similar articles

Cited by

References

    1. Saxena V, et al. Dual roles of immunoregulatory cytokine TGF-beta in the pathogenesis of autoimmunity-mediated organ damage. J Immunol. 2008;180(3):1903–1912. doi: 10.4049/jimmunol.180.3.1903. - DOI - PMC - PubMed
    1. Singh RR. SLE: translating lessons from model systems to human disease. Trends Immunol. 2005;26(11):572–579. doi: 10.1016/j.it.2005.08.013. - DOI - PMC - PubMed
    1. Wynn TA. Fibrotic disease and the T(H)1/T(H)2 paradigm. Nat Rev Immunol. 2004;4(8):583–594. doi: 10.1038/nri1412. - DOI - PMC - PubMed
    1. Divekar AA, et al. Treatment with imatinib results in reduced IL-4-producing T cells, but increased CD4(+) T cells in the broncho-alveolar lavage of patients with systemic sclerosis. Clin Immunol. 2011;141(3):293–303. doi: 10.1016/j.clim.2011.08.010. - DOI - PMC - PubMed
    1. Greenblatt MB, Aliprantis AO. The immune pathogenesis of scleroderma: context is everything. Curr Rheumatol Rep. 2013;15(1):297. doi: 10.1007/s11926-012-0297-8. - DOI - PMC - PubMed

Publication types

MeSH terms