. 2018 May 1;9(1):1752.
doi: 10.1038/s41467-018-04038-6.

Dkk3 dependent transcriptional regulation controls age related skeletal muscle atrophy

Affiliations

Dkk3 dependent transcriptional regulation controls age related skeletal muscle atrophy

Jie Yin et al. Nat Commun. .

Abstract

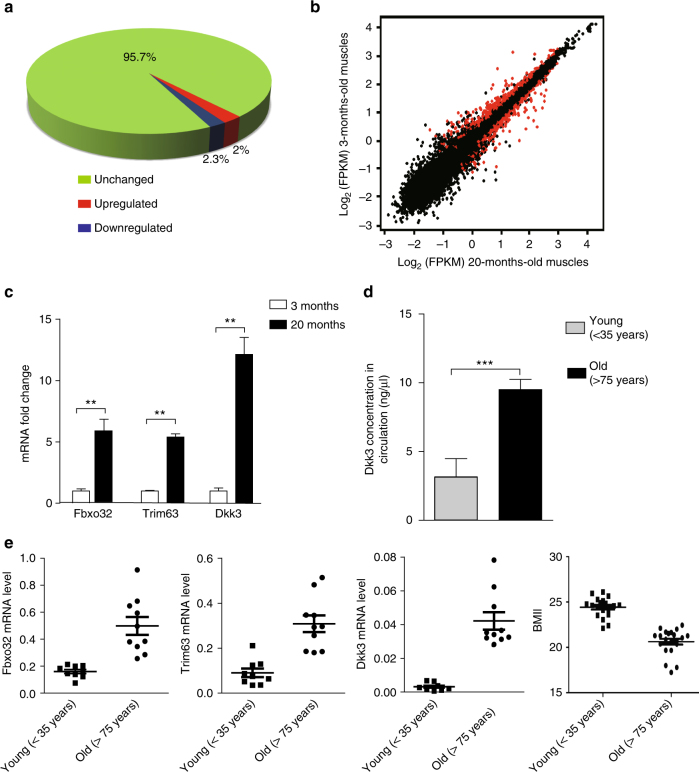
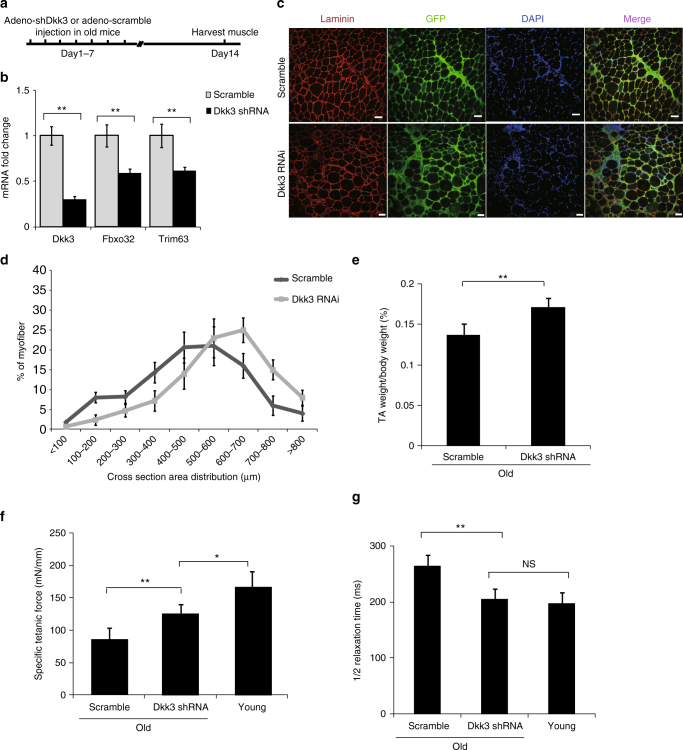
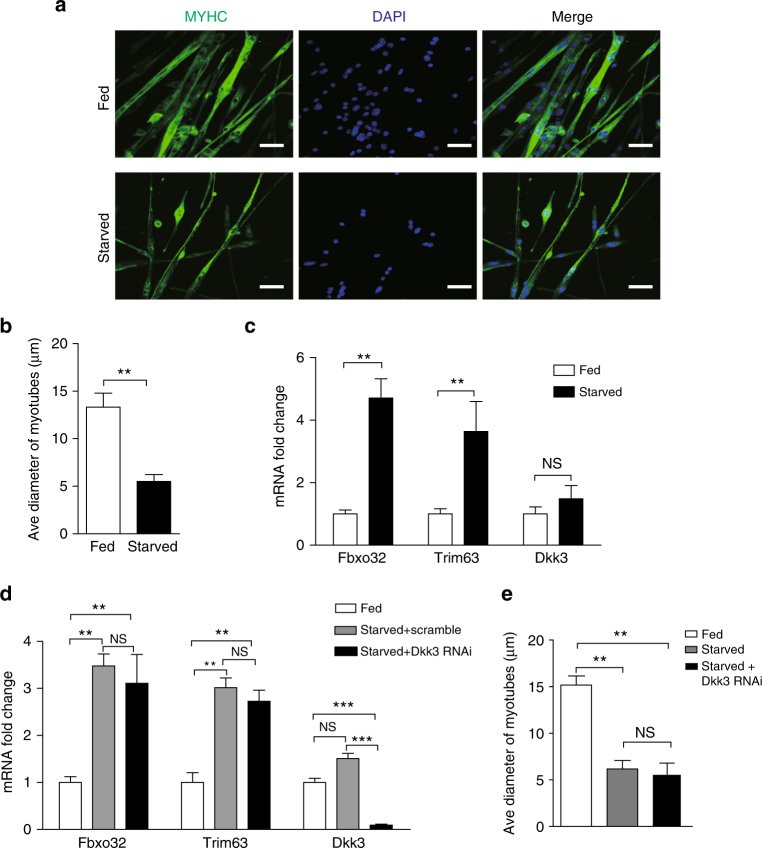
Age-related muscle atrophy (sarcopenia) is the leading cause for disability in aged population, but the underlying molecular mechanisms are poorly understood. Here we identify a novel role for the secreted glycoprotein Dickkopf 3 (Dkk3) in sarcopenia. Forced expression of Dkk3 in muscles in young mice leads to muscle atrophy. Conversely, reducing its expression in old muscles restores both muscle size and function. Dkk3 induces nuclear import of β-catenin and enhances its interaction with FoxO3, which in turn activates the transcription of E3 ubiquitin ligase Fbxo32 and Trim63, driving muscle atrophy. These findings suggest that Dkk3 may be used as diagnostic marker and as therapeutic target for age-related muscle atrophy, and reveal a distinct transcriptional control of Fbxo32 and Trim63.


Conflict of interest statement

The authors declare no competing interests.

Figures

Fig. 1
Fig. 1
Dkk3 is upregulated in muscles with age-related atrophy. a A pie diagram indicating the percentage of genes showing expression level changes in old versus young muscles. RNA was isolated from TA muscles showing atrophy and subjected for mRNA-sequencing analysis. The percentage of genes downregulated in TA muscles isolated from old mice compared to that in TA muscle isolated from young mice was indicated by blue. The percentage of genes upregulated in old TA muscles was indicated by red. The percentage of genes unchanged was indicated by green. b A scatter plot showing the comparison of transcriptome of old muscles showing atrophy versus young muscles. The red dots indicated the genes that were differentially expressed in old muscles versus young muscles. Statistic analysis was based on two independent mRNA-seq experiments for each sample. c Expression levels of Fbxo32, Trim63, and Dkk3 in primary myofibers isolated from young or old mice, respectively. RT-qPCR was performed with RNA extracted from the primary myofibers. Error bars indicated standard deviation (s.d.) and were based on three independent experiments. ** indicated p < 0.01. d Dkk3 protein level was elevated in peripheral blood of sarcopenia patients. Dkk3 protein level was examined by ELISA in blood samples taken from sarcopenia patients and healthy young humans. Error bars indicated s.d. and were based on 20 samples. *** indicated p < 0.001. e Dkk3 expression level was correlated with Fbxo32 and Trim63 expression level and BMI (body mass index) in aged human muscles. RT-qPCR assays were performed with muscle biopsies obtained from young or old patients and the results were normalized to GAPDH. The line indicated mean value. Error bars indicated s.d. and were based on 10 biological replicas. All p-values were based on two-tailed t-test
Fig. 2
Fig. 2
Over-expression of Dkk3-induced atrophy in cultured myotubes. a Representative images of myotubes over-expressing Dkk3. Primary myotubes were infected by adenovirus-encoding Dkk3 or control vector. Seventy two hours after infection, the myotubes over-expressing Dkk3 were significantly thinner than those infected by control vector. Green indicated myosin heavy chain (MYHC) immunofluorescent staining. Blue indicated DAPI staining of nuclei; Merge indicated merged images of MYHC and DAPI. Scale bars, 50 μm. b Quantification of the average diameters of the myotubes over-expressing Dkk3 or vector control. Error bars indicated s.d. and were based on three independent experiments. The diameters of 900 myotubes were measured in each experiment. ** indicated p < 0.01. c Fbxo32 and Trim63 expression levels increased after Dkk3 over-expression. Vector indicated myotubes infected with adenovirus-encoding vector control. Dkk3 indicated myotubes infected with adenovirus-encoding Dkk3. Error bars indicated s.d. and were based on three independent experiments. ** indicated p < 0.01. d Over-expression of Dkk3 increased the protein levels of Fbxo32 and Trim63. Immunoblotting assays were performed with whole-cell extracts from myotubes over-expressing Dkk3 or vector control. Dkk3 was tagged with Flag tag. GAPDH served as internal control. All p-values were based on two-tailed t-test
Fig. 3
Fig. 3
Over-expression of Dkk3 in vivo induced muscle atrophy in young mice. a The schedule of virus injection. b Adenovirus-encoding Flag-Dkk3-IRES-GFP was injected to TA muscles in young mice (3 months) intramuscularly. Adenovirus-encoding GFP vector was injected to the TA muscle in mice with the same age and gender. Injections were performed once a day for 7 continuous days. TA muscles were harvested at day 14 for further analysis. A small portion of the TA muscles was used to make protein extracts. Anti-Flag immunoblotting was performed to detect the expression of the ectopic Flag-Dkk3. c Immunofluorescent staining images of muscle cross sections derived from TA muscles over-expressing Dkk3 or vector control. Red indicated laminin staining; green indicated GFP; DAPI indicated nuclei; merge indicated merged images of laminin, GFP, and DAPI. Scale bars, 50 μm. d Percentage distribution of muscle fiber cross section area derived from muscles over-expressing Dkk3 or GFP. The cross areas of all 1500 fibers in each TA muscle were checked. Black squares indicated muscle sections with ectopic Dkk3 expression. Gray dots indicated muscle sections expressing vector. Error bars indicated s.d. and were based on five independent experiments. e Fbxo32 and Trim63 mRNA levels were measured by RT-qPCR in TA muscles with ectopic Dkk3 or GFP expression. Error bars indicated s.d. and were based on five independent experiments. ** indicated p < 0.01. f Weight of TA muscles over-expressing Dkk3 was compared to that expressing vector control. Error bars indicated s.d. and were based on five independent experiments. ** indicated p < 0.01. fg Specific titanic force of TA muscles over-expressing Dkk3 or vector control in young mice (3 months). Error bars indicated s.d. and were based on 5 independent experiments. ** indicated p < 0.01. h 1/2 relaxation time of TA muscles over-expressing Dkk3 or vector control in young mice (3 months). 1/2 relaxation time of TA muscles in old mice were compared to that of young mice (3 months). Error bars indicated s.d. and were based on five independent experiments. ** indicated p < 0.01. All p-values were based on two-tailed t-test
Fig. 4
Fig. 4
Reduction of Dkk3 level rescued age-related muscle atrophy. a Adenovirus-encoding shRNA against Dkk3 was injected to TA muscles in old mice (20 months) intramuscularly. Adenovirus-encoding scramble shRNA was injected to the TA muscle in a mouse with the same age and gender as control. Both pieces of shRNA were co-expressed with GFP to label the infected muscle fibers in vivo. Injections were performed once a day for 7 continuous days. TA muscles were harvested at day 14 for further analysis. b Gene expression levels of Dkk3, Fbxo32, and Trim63 in TA muscles injected with shRNA against Dkk3 or scramble control as indicated by RT-qPCR. Error bars indicated s.d. and were based on five independent experiments. ** indicated p < 0.01. c Representative immunofluorescent staining images of muscle cross sections derived from TA muscles in old mice treated with shRNA against Dkk3 or scramble control. The cross areas of all 1500 fibers in each TA muscle were checked. Red indicated laminin staining; green indicated GFP; DAPI indicated nuclei; merge indicated merged images of laminin, GFP, and DAPI staining. Scale bars, 50 μm. d Percentage distribution of muscle fiber cross section area derived from muscles treated with shRNA against Dkk3 or scramble control. Black dots indicated muscle sections with scramble control treatment. Gray squares indicated muscle sections with Dkk3 RNAi. e The percentage of TA muscle (by weight) in whole body muscles derived from mice treated with shRNA against Dkk3 or scramble control. Error bars indicated s.d. and were based on five independent experiments. ** indicated p < 0.01. f Specific titanic force of TA muscles treated with shRNA against Dkk3 or scramble control in old mice (20 months). The specific titanic force of TA muscles in old mice were compared to that of young mice (3 months). g 1/2 relaxation time of TA muscles treated with shRNA against Dkk3 or scramble control in old mice (20 months). 1/2 relaxiation time of TA muscles in old mice were compared to that of young mice (3 months). All error bars indicated s.d. based on 5 independent experiments. ** indicated p < 0.01. * indicated p < 0.1. NS indicated no significant changes. All p-values were based on two-tailed t-test
Fig. 5
Fig. 5
Starvation-induced muscle atrophy did not depend on Dkk3. a Representative images of atrophy induced by starvation in myotubes. Green indicated MYHC staining; blue indicated DAPI staining of nuclei; Merge indicated merged images of MYHC and DAPI. Scale bars, 50 μm. b Average diameters of myotubes with or without serum starvation. Error bars indicated s.d. and were based on three independent experiments. ** indicated p < 0.01. c Expression levels of Fbxo32, Trim63, and Dkk3 in fed or starved myotubes. Error bars indicated s.d. and were based on three independent experiments. ** indicated p < 0.01. NS indicated no significant changes. d Dkk3 RNAi showed no effects on Fbxo32 and Trim63 expression level in starved myotubes. Primary myotubes were first serum starved in Hank’s buffer. Adenovirus-encoding shRNA against Dkk3 or scramble control was next applied to the starved myotubes. Forty-eight hours after virus infection, the myotubes were harvested and subjected for RT-qPCR analysis of the mRNA levels of Fbxo32, Trim63,and Dkk3. Error bars indicated s.d. and were based on three independent experiments. ** indicated p < 0.01. NS indicated no significant changes. e Average diameters of myotubes with or without serum starvation, and Dkk3 RNAi after serum starvation. Error bars indicated by s.d. and were based on three independent experiments. ** indicated p < 0.01. NS indicated no significant changes. All p-values were based on two-tailed t-test
Fig. 6
Fig. 6
Dkk3-induced FoxO3-dependent recruitment of β-catenin on the core promoters of Fbxo32 and Trim63. a Schematic illustration of the core promoter structures of Fbxo32 and Trim63. b ChIP analysis of RNA pol II, FoxO3, β-catenin, and Tcf3 on Fbxo32 and Trim63 promoters in primary myotubes treated with Dkk3 or control protein. Error bars indicated s.d. and were based on four independent experiments. * indicated p < 0.1. ** indicated p < 0.01. *** indicated p < 0.001. NS indicated no significant changes. c ChIP analysis of RNA pol II, FoxO3, β-catenin, and Tcf3 on core promoters of Fbxo32 and Trim63 in muscle tissues isolated from young adult (3 months) or aged (20 months) mice. Error bars indicated s.d. and were based on five independent experiments. * indicated p < 0.1. ** indicated p < 0.01. *** indicated p < 0.001. NS indicated no significant changes. d Nuclear extracts prepared from myotubes treated with Dkk3 or control protein were subjected to immunoprecipitation with FoxO3 antibody. The immunoprecipitated proteins were subjected to immunoblotting with β-catenin and Tcf3. Lane 1 and 2 were 10% of input nuclear extracts. Lane 3 and 4 represented immunoprecipitation with FoxO3 antibody. e ChIP analysis of RNA pol II, FoxO3, β-catenin, and Tcf3 on the core promoters of Fbxo32 and Trim63 in FoxO3 null TA muscles with or without Dkk3 over-expression. Error bars indicated s.d. and were based on five independent experiments. * indicated p < 0.1. ** indicated p < 0.01. *** indicated p < 0.001. NS indicated no significant changes. All p-values were based on two-tailed t-test

Similar articles

Cited by

References

    1. Cesari M, Landi F, Vellas B, Bernabei R, Marzetti E. Sarcopenia and physical frailty: two sides of the same coin. Front Aging Neurosci. 2014;6:192. - PMC - PubMed
    1. Kalinkovich A, Livshits G. Sarcopenia--The search for emerging biomarkers. Ageing Res. Rev. 2015;22:58–71. doi: 10.1016/j.arr.2015.05.001. - DOI - PubMed
    1. Elabd C, et al. Oxytocin is an age-specific circulating hormone that is necessary for muscle maintenance and regeneration. Nat. Commun. 2014;5:4082. doi: 10.1038/ncomms5082. - DOI - PMC - PubMed
    1. Bodine SC, et al. Identification of ubiquitin ligases required for skeletal muscle atrophy. Science. 2001;294:1704–1708. doi: 10.1126/science.1065874. - DOI - PubMed
    1. Gomes MD, Lecker SH, Jagoe RT, Navon A, Goldberg AL. Atrogin-1, a muscle-specific F-box protein highly expressed during muscle atrophy. Proc. Natl Acad. Sci. USA. 2001;98:14440–14445. doi: 10.1073/pnas.251541198. - DOI - PMC - PubMed

Publication types

MeSH terms