. 2018 Apr 25;9(1):1659.
doi: 10.1038/s41467-018-04083-1.

Exercise induces new cardiomyocyte generation in the adult mammalian heart

Affiliations

Exercise induces new cardiomyocyte generation in the adult mammalian heart

Ana Vujic et al. Nat Commun. .

Abstract

Loss of cardiomyocytes is a major cause of heart failure, and while the adult heart has a limited capacity for cardiomyogenesis, little is known about what regulates this ability or whether it can be effectively harnessed. Here we show that 8 weeks of running exercise increase birth of new cardiomyocytes in adult mice (~4.6-fold). New cardiomyocytes are identified based on incorporation of 15N-thymidine by multi-isotope imaging mass spectrometry (MIMS) and on being mononucleate/diploid. Furthermore, we demonstrate that exercise after myocardial infarction induces a robust cardiomyogenic response in an extended border zone of the infarcted area. Inhibition of miR-222, a microRNA increased by exercise in both animal models and humans, completely blocks the cardiomyogenic exercise response. These findings demonstrate that cardiomyogenesis can be activated by exercise in the normal and injured adult mouse heart and suggest that stimulation of endogenous cardiomyocyte generation could contribute to the benefits of exercise.


Conflict of interest statement

The authors declare no competing interests.

Figures

Fig. 1
Fig. 1
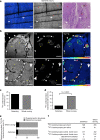
Cardiomyocyte cell cycle activity is increased in the exercised heart 15N-thymidine was administered continuously for 8 weeks to young adult mice (2 months old) undergoing voluntary wheel running vs. sedentary activity. a Mass 14N image (top left, bottom left) shows histological details such as sarcomeres (large red arrows), mass 31P image (center, top and bottom) shows nucleus and chromatin condensation, while the hue-saturation-intensity image (mosaic, top, and bottom right) demonstrates nuclear 15N labeling of a cardiomyocyte (yellow asterisk), non-labeled cardiomyocytes (large white arrows) can also be found in that section, as well as, two labeled non-cardiomyocytes (bottom right, small white arrows) and one non-labeled non-cardiomyocyte (top right, small white arrow). The scale ranges from blue, where the ratio is equivalent to natural ratio (0.37%, expressed as 0% above natural ratio (enrichment over natural ratio)), to red, where the ratio is 150% above natural ratio. 15N-thymidine has labeled the nucleus while the cytoplasm is at the natural abundance level. Scale bar = 10 μm. b Comparison of the percentage of 15N-labeled cardiomyocyte nuclei in exercised to sedentary young adult hearts. Exercise increases cardiomyocyte cell cycle activity (sedentary:exercise = 1.24:3.62%; >1000 cardiomyocytes from four mice per group were counted, ***p = 0.0003, Fisher’s exact test). c Contingency table showing the absolute numbers and percentage calculations of 15N-positive and 15N-negative cardiomyocytes
Fig. 2
Fig. 2
Number of mononucleate diploid 15N-labeled cardiomyocytes increases with exercise. a Serial sections (0.5–1 μm thickness) were processed to determine the ploidy status and number of nuclei of each 15N-labeled cardiomyocyte (large white arrow). Periodic acid Schiff staining (PAS) was performed on serial adjacent sections in both directions from the MIMS chip to define the number of nuclei contained in the cell and fluorescent in situ hybridization (Y-chromosome) was performed to identify ploidy status. A representative image series is shown from a mononucleate (PAS staining far left/right, scale bar = 10 μm) diploid (2 N, second from left, scale bar = 5 μm) 15N-labeled (MIMS second from right, scale bar = 10 μm) cardiomyocyte. 14N and 31P images are shown for subcellular resolution (center, scale bar = 10 μm). b Representative image of a 15N-labeled cardiomyocyte nuclei undergoing binucleation. Scale bar = 10 μm for mass image 14N and 15N/14N (left, center). Scale bar = 4 μm for mass image 15N/14N (right). c Bar graph showing the frequency of mononucleate/diploid vs. polyploid and/or multinucleate 15N-thymidine-labeled cardiomyocytes from each group (graph) and contingency table showing absolute numbers and percentage calculations of 15N-positive and all identified cardiomyocytes (sedentary: exercised = 0.25%:1.15%, n = 4 mice per group, *p = 0.01, Fisher’s exact test, OR = 4.695, CI 1.44–15.53). d Mononucleate 15N-thymidine labeled cardiomyocytes were significantly smaller than their binucleate counterparts in the same hearts (n = 3 mice per group, one-way ANOVA with Tukey’s correction for multiple comparisons (significance level p < 0.05). Error bars represent ± s.e.m
Fig. 3
Fig. 3
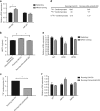
Exercise induces cardiomyogenesis in an extended MI border zone. Mice were subjected to experimental myocardial infarction (MI) by ligation of the left anterior descending artery and exposed to exercise or sedentary activity for 8 weeks, starting 24 h post surgery. Subcutaneous osmotic pumps were implanted to continuously label mice with 15N-thymidine for eight weeks following surgery. a Myocardial ischemic injury results in extensive DNA synthesis in the peri-infarct area. 15N:14N hue-saturation-intensity image (HSI mosaic) (left) demonstrates 15N+ cells while 14N mass image (center) and PAS staining (right) demonstrate presence of cardiomyocytes (white arrow) and a visible scar/fibrosis (dark purple PAS staining, red asterisks). The HSI mosaic scale ranges from blue, where the ratio is equivalent to natural ratio (0% above natural ratio (enrichment over natural ratio)), to red, where the ratio is 150% above natural ratio. Scale bar = 60 μm. b Representative magnifications from the peri-infarct and extended border zone areas. Mass 14N image (top left, bottom left), mass 31P image (center, top, and bottom), and the HSI mosaic (top right, bottom right) demonstrate nuclear 15N labeling of cardiomyocytes undergoing DNA synthesis (yellow asterisk), non-labeled-cardiomyocytes (large white arrows), and 15N-labeled non-cardiomyocytes (small white arrows). Scale bar = 56 μm. 15N-thymidine has exclusively labeled the nucleus while the cytoplasm is at the natural abundance level. c Percentage of 15N+ cardiomyocyte nuclei after MI with or without exercise in the peri-infarct region (sedentary:exercise = 22.76%:20.43%; >400 cells from three mice per group were counted, p = ns, Fisher’s exact test) and d the extended border zone of the infarct (sedentary: exercise = 5.29%:19.09%; >500 cells from three mice per group were counted, p < 0.0001, Fisher’s exact test). e Bar graph showing the frequency of mononucleate/diploid vs. polyploid and/or multinucleate 15N-thymidine-labeled cardiomyocytes from each group. f Contingency table showing the absolute numbers of 15N-labeled mononucleate/diploid cells of total counted cardiomyocytes from each group (sedentary:exercise = 0.4%:2.7%, p = 0.004, Fisher’s exact test, OR = 6.931, CI 1.87–30.83)
Fig. 4
Fig. 4
Inhibition of miR-222 prevents exercise-induced cardiomyogenesis. a miR-222 is upregulated after eight weeks of voluntary wheel running in young adult mice (n = 6 mice per group, *p = 0.01, Student’s t test). b Mice underwent simultaneous 15N-thymidine infusion and LNA-anti-miR-222 or control LNA-anti-miR (LNA-Ctr) treatment for 8 weeks of sedentary activity or voluntary wheel running. miR-222 inhibition blocks physiologic cardiac hypertrophy measured by heart weight/tibia length (HW/TL) (n = 5 mice per group, *p < 0.05 running LNA-anti-miR-222 vs. running LNA-Ctr, #p < 0.05 running LNA-Ctr vs. sedentary LNA-anti-miR-222, one-way ANOVA with Tukey’s post-test for multiple comparisons). c Similar to exercise only, exercised mice injected with LNA-Ctr for 8 weeks show an increase in 15N-thymidine-positive cardiomyocytes. However, exercised mice treated with LNA-anti-miR-222 demonstrate a reduced number of 15N-thymidine-positive cardiomyocytes closer to sedentary baseline levels (800–1350 cells from four mice per group were counted *p = 0.0255, Fisher’s exact test). d Contingency table showing the absolute numbers and percentage calculations of 15N-positive and 15N-negative cardiomyocytes. e Exercised mouse hearts show downregulation of miR-222 target HIPK1. Bar graph depicting quantitative results from gene expression analysis from heart lysates after 8 weeks of voluntary wheel running demonstrates significant downregulation specifically of HIPK1 (n = 3 mice per group, *p < 0.05, Student’s t test). f miR-222 inhibition during 8 weeks of voluntary wheel running leads to HIPK1 overexpression (n = 5 mice per group, *p < 0.05, Student’s t test). Error bars represent ± s.e.m
Fig. 5
Fig. 5
Hypoxia and hippo pathways are not directly targeted by miR-222. a, b qPCR was used to analyze mRNA levels of genes relevant for hypoxia-induced effects in exercised vs. sedentary hearts (a) and hearts from mice treated with LNA-anti-miR222 or LNA-scr-miR undergoing voluntary wheel running (b) (n = 3–5 mice per group, *p < 0.05, Student’s t test). c p value from significantly differential pathways analyzed by ingenuity pathway analysis (IPA, Qiagen) of a microarray conducted from neonatal rat ventricular myocytes (NRVM) treated with control precursor (ctl-pre) and miR-222 precursor (pre-miR-222), respectively (n = 4 individual samples per group). d, e qPCR was used to analyze mRNA levels of genes relevant for hippo pathway-induced effects in exercised vs. sedentary hearts (d) and hearts from mice treated with LNA-anti-miR222 or LNA-scr-miR undergoing voluntary wheel running (e) (n = 3–5 mice per group, *p < 0.05, Student’s t test). f Gene expression signal specifically for CCGN2 and TEAD2 detected in a microarray conducted from neonatal rat ventricular myocytes (NRVM) treated with control precursor (ctl-pre) and miR-222 precursor (pre-miR-222), respectively (n = 4 individual samples per group, *p < 0.05, Student’s t test). Error bars represent ± s.e.m

Similar articles

Cited by

References

    1. Rumyantsev PP. Interrelations of the proliferation and differentiation processes during cardiac myogenesis and regeneration. Int. Rev. Cytol. 1977;51:186–273. - PubMed
    1. Steinhauser ML, et al. Multi-isotope imaging mass spectrometry quantifies stem cell division and metabolism. Nature. 2012;481:516–519. doi: 10.1038/nature10734. - DOI - PMC - PubMed
    1. Senyo SE, et al. Mammalian heart renewal by pre-existing cardiomyocytes. Nature. 2013;493:433–436. doi: 10.1038/nature11682. - DOI - PMC - PubMed
    1. Bergmann O, et al. Evidence for cardiomyocyte renewal in humans. Science. 2009;324:98–102. doi: 10.1126/science.1164680. - DOI - PMC - PubMed
    1. Bergmann O, et al. Dynamics of cell generation and turnover in the human heart. Cell. 2015;161:1566–1575. doi: 10.1016/j.cell.2015.05.026. - DOI - PubMed

Publication types

MeSH terms