. 2018 Oct 1;99(4):838-852.
doi: 10.1093/biolre/ioy096.

Polycystic ovary syndrome: possible involvement of androgen-induced, chemerin-mediated ovarian recruitment of monocytes/macrophages

Affiliations

Polycystic ovary syndrome: possible involvement of androgen-induced, chemerin-mediated ovarian recruitment of monocytes/macrophages

Patricia D A Lima et al. Biol Reprod. .

Abstract

Polycystic ovary syndrome (PCOS) is a continuum of endocrine and reproductive disorders characterized by hyperandrogenism, antral follicle growth arrest, and chronic inflammation. Macrophages play key role in inflammation, and the balance between M1 (inflammatory) and M2 (anti-inflammatory) macrophages determines physiological/pathological outcomes. Here, we investigated if hyperandrogenism increases ovarian chemerin altering the balance of M1 and M2 macrophages and the granulosa cell death. Ovarian chemerin was upregulated by 5α-dihydrotestosterone (DHT) in lean and overweight rats; while increased serum chemerin levels were only evident in overweight rats, suggesting that the serum chemerin may be reflective of a systemic response and associated with obesity, whereas increased ovarian chemerin expression is a localized response independent of the metabolic status. DHT altered follicle dynamics while increased the M1: M2 macrophages ratio in antral and pre-ovulatory follicles. While ovarian M1 macrophages expressing chemokine-like receptor 1 (CMKLR1) were increased, CMKLR1+ monocytes, which migrated toward chemerin-rich environment, were markedly decreased after 15 days of DHT. Androgen-induced granulosa cell apoptosis was dependent on the presence of macrophages. In humans, chemerin levels in follicular fluid, but not in serum, were higher in lean PCOS patients compared to BMI-matched controls and were associated with increased M1: M2 ratio. Our results support the concept that in PCOS, hyperandrogenemia increases chemerin expression while promotes CMKLR1+ monocytes recruitment and deregulates the immunological niche of ovaries. This study established a new immunological perspective in PCOS at the ovarian level. Hyperandrogenism is associated with upregulation of chemerin and macrophage unbalance in the ovaries.


Figures
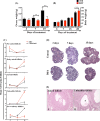
Figure 1.
Figure 1.
DHT-induced changes in the ovarian morphology. (A and B) Ovarian and body weight of DHT-treated and control rats at 3, 7, 15, and 28 days. Significant changes in the ovarian weight (A) were observed in 7 and 15 days after DHT treatment (P < 0.001), while changes in body weight (B) were only detected after 28 days of DHT (P < 0.001). (C) Quantification of specific ovarian follicles (pre-antral, early antral, antral, unhealthy, and pre-ovulatory follicles) overtime in control and DHT-treated rats. Early antral and unhealthy follicles were more numerous in DHT-treated ovaries after 15 days. Pre-ovulatory follicles’ number was reduced in 15 days DHT-treated ovaries but it was not significant different. (D) Panoramic view ovaries from control and DHT treated rats after 3, 7 and 15 days. (E) shows examples of a healthy early antral follicle (i) and an unhealthy follicle (ii) in DHT-treated ovary. Unhealthy follicles had evident oocyte, antral space (*), and an intact layer of theca cells, while the thickness of the granulosa cell layer was reduced.
Figure 2.
Figure 2.
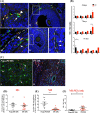
DHT-induced changes in ovarian M1 and M2 macrophage balance. Immunolocalization and quantification of M1 and M2 macrophages in the ovaries from DHT-treated rats (A, B) and from humans (non-PCOS vs PCOS; C–F). (A) Rat ovarian macrophages were identified using anti-CD68 (green) and anti-CD163 (red). (A, i) M1 (arrows; green) and M2 (arrowheads; yellow) macrophages in the theca layer from an ovarian follicle. (A, ii) An antral follicle delineated by white broken line; macrophages are located in the theca cells layer. (A, iii) A digital magnification of (A, ii) demonstrating the presence of M1 (arrow) and M2 macrophages (arrowhead). (A, iv) An early antral follicle delineated by white dashes; (A, v) a digital magnification of Aiv shows the presence of M1 macrophages (arrow) in the theca cells layer. (B) M1: M2 ratio of individual ovarian follicles in control and rats treated with DHT for 3, 7, and 15 days. The M1: M2 ratio in pre-ovulatory follicles was significantly higher after 7 days of DHT treatment. (C) Human stromal macrophages were identified using anti-human MCH II (red; arrows—M1) and CD163 (green; arrowheads—M2) in non-PCOS (C, i) and PCOS (C, ii) ovaries. The quantification of stromal M1 (D) and M2 (E) macrophages (per area of ×20 magnification - 0.37985 mm2) showed that M2 were significantly reduced in PCOS ovaries compared to control (P < 0.001). No difference was found with M1 macrophages, but the M1: M2 ratio (F) demonstrated to be significantly higher in PCOS subjects compared to control (P < 0.01). DAPI (nucleus; blue). Magnification of images (Ai): ×40 (Aii, Aiv, Ci and Cii): ×20, (Aiii and v) are digital magnification of Aii and Aiv. PAF: pre-antral follicle, EAF: early antral follicle, AF: antral follicle, POF: pre-ovulatory follicle and UF: unhealthy follicle.
Figure 3.
Figure 3.
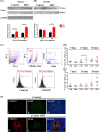
DHT-induced granulosa cell apoptosis is dependent on the presence of macrophages. (A) In situ TUNEL assay in ovaries from rats treated with DHT for 3 and 7 days. (Ai and Aii) TUNEL + (green) mature and immature ovarian follicles, respectively. (B) Mean number of TUNEL + ovarian follicles per section at 3 and 7 days of DHT treatment. The quantification of TUNEL + ovarian follicles was normalized by the total mean number of specific ovarian follicles per histological section. Apoptotic pre-ovulatory follicles were higher after 7 days of DHT treatment (P < 0.05). (C) Flow cytometric analysis of early (annexin V+) and late (annexin V+7-AAD+) apoptotic cells following 12 and 24 h of DHT treatment. After DHT treatment, early and late apoptosis in granulosa cells were assessed in single culture (D–F) and in co-culture with macrophages (G–I). DHT did not affect the apoptosis or necrosis of granulosa cells in single culture (D–F), while the presence of macrophages increased early (12 and 24 h; P < 0.05, G) and late apoptosis (24 h; P < 0.05; H) of granulosa cells, but not necrosis (I).
Figure 4.
Figure 4.
Chemerin and CMKLR1+ ovarian macrophages in PCOS women. (A and B) Chemerin content in human follicular fluid (A) and serum (B) from non-PCOS and PCOS subjects. Chemerin level was higher in follicular fluid (P < 0.05) but not in serum from PCOS patients compared to control. (C, D) Human stromal M1 macrophages expressing CMKLR1 (arrows) were identified (C) and quantified (D) through immunofluorescence using anti-human MCH II (red) and anti-human CMKLR1 (green). No significant differences were found in the incidence of ovarian MHC II+CMKLR1+ cells between PCOS and non-PCOS subjects. DAPI (nucleus; blue). Magnification of image (C): ×20.
Figure 5.
Figure 5.
Chemerin and CMKLR1+ ovarian macrophages in DHT-treated rats. (A and B) Chemerin content in rat ovaries (A) and serum (B) after15 and 28 days of treatment with DHT. DHT-treated ovaries had higher chemerin content (P < 0.001 and P < 0.001, respectively) compared to control in both treatments (A). Serum chemerin (B) was significant higher in rats treated with DHT only after 28 days (P < 0.05), but not after 15 days. (C) Gating strategy used to identify ovarian M1 and M2 macrophages expressing CMKLR1. Side scatter (SS) and forward scatter (FS) were used to gate total ovarian leukocytes. M1 (CD68+CD163–) and M2 (CD68+CD163+ cells) macrophages were gated from viable leukocytes. The frequency of M1 and M2 macrophages expressing CMKLR1 was measured in comparison to the isotype control. M1 macrophages expressing CMKLR1 at 15 days of DHT treatment were significantly higher compared to control (P < 0.05), but not at 7 (P = 0.070) or 28 (P = 0.715) days (D). No differences were found in CMKLR1+ M2 macrophages in any day of DHT treatment [7 days (P < 0.713), 15 days (P < 0.715) 28 days (P < 0.057)] (E). (F) Double immunofluorescence using anti-CD68 (green; macrophages) and anti-CMKLR1 (red) on ovarian sections of 15 days DHT-treated rats. Low expression of CMKLR1 was observed in control ovaries (F, i–iii). The intensity of CMKLR1 staining was higher in the granulosa cells and CD68+ macrophages (arrows) from DHT-treated ovaries (F, iv-vi) compared to control. DAPI (nucleus; blue). Magnification of image (F): ×40.
Figure 6.
Figure 6.
DHT does not alter splenic CMKLR1+ macrophages, but decreases the number of CMKLR1+ monocytes while chemerin functions as chemoattractant. (A) Gating strategy used to identify splenic M1 and M2 macrophages expressing CMKLR1. Side scatter (SS) and forward scatter (FS) were used to gate total leukocytes, while M1 (CD68+CD163+) and M2 (CD68+CD163+) macrophages were gated from viable leukocytes. The frequency of M1 and M2 macrophages expressing CMKLR1 was measured in comparison to isotype control. (B, C) Quantification of M1 (B) and M2 (C) macrophages revealed that splenic M1 macrophages were significantly higher in rats treated with DHT for 28 days (P < 0.05), but not for 15 days. No differences were found comparing the incidence of M2 macrophages. (D, E) DHT did not alter the incidence of CMKLR1+M1 or CMKLR1+M2 macrophages in the spleen. (F) Gating strategy used to identify monocytes expressing CMKLR1. Total mononuclear cells were gated based on their SS and FS properties and on viability. (G) Monocytes were identified as CD3–CD11b/c+CD43 high (nonclassical monocytes) and CD3–CD11b/c+CD43low (classical monocytes) cells expressing or not CMKLR1. Quantification of classical CMKLR1+ and nonclassical CMKLR1+ monocytes showed that both subsets were affected in a manner dependent on the duration of DHT treatment. Classical monocytes expressing CMKLR1 was reduced at 15 days after DHT treatment compared to control rats (P < 0.05), while nonclassical monocytes expressing CMKLR1 were significantly reduced in rats treated for 7 and 15 days (P < 0.05). (H–I) Time-course study showing the migration of mononuclear cells in response to chemerin (100 ng/ml; 6 h, 12 h, and 24 h). (H) Representative images used to quantify the migrations of mononuclear cells after 6 h (H, i), 12 h (H, ii), 24 h (H, iii), and 24 h control (H, iv). Increased mononuclear cells migration was observed after 24 h of chemerin incubation compared to control group (P < 0.05). No significant differences were observed with 6 or 12 h.
Figure 7.
Figure 7.
Hypothetical model illustrating the role of chemerin in the androgenic regulation of immune cells in the ovary and granulosa cell fate. (A) Physiological levels of androgen and chemerin are important in maintaining cellular and immunological homeostasis in the ovary. M1 and M2 macrophages are present in the ovarian follicles and promote follicle growth. (B) Under hyperandrogenic conditions, as commonly observed in PCOS, androgen promotes the production of chemerin by granulosa cells which function as a chemoattractant and induces the migration of CMKLR1+ monocytes from the circulation to the ovarian tissue, where they are differentiated in CMKLR1+ M1 macrophages. Inflammatory CMKLR1+ macrophages under androgenic stimulus contribute to the granulosa cells apoptosis and follicle growth arrest.

Similar articles

Cited by

References

    1. March WA, Moore VM, Willson KJ, Phillips DI, Norman RJ, Davies MJ. The prevalence of polycystic ovary syndrome in a community sample assessed under contrasting diagnostic criteria. Hum Reprod 2010; 25(2):544–551. - PubMed
    1. Rotterdam ESHRE/ASRM-Sponsored PCOS Consensus Workshop Group Revised 2003 consensus on diagnostic criteria and long-term health risks related to polycystic ovary syndrome. Fertil Steril 2004; 81(1):19–25. - PubMed
    1. Diamanti-Kandarakis E, Paterakis T, Alexandraki K, Piperi C, Aessopos A, Katsikis I, Katsilambros N, Kreatsas G, Panidis D. Indices of low-grade chronic inflammation in polycystic ovary syndrome and the beneficial effect of metformin. Hum Reprod 2006;21(6):1426–1431. - PubMed
    1. Kelly CC, Lyall H, Petrie JR, Gould GW, Connell JM, Sattar N. Low grade chronic inflammation in women with polycystic ovarian syndrome. J Clin Endocrinol Metab 2001; 86(6):2453–2455. - PubMed
    1. Amato G, Conte M, Mazziotti G, Lalli E, Vitolo G, Tucker AT, Bellastella A, Carella C, Izzo A. Serum and follicular fluid cytokines in polycystic ovary syndrome during stimulated cycles. Obstet Gynecol 2003; 101(6):1177–1182. - PubMed

Publication types

MeSH terms

Grants and funding