. 2018 May 3;173(4):864-878.e29.
doi: 10.1016/j.cell.2018.03.028. Epub 2018 Apr 19.

Chemistry-First Approach for Nomination of Personalized Treatment in Lung Cancer

Affiliations

Chemistry-First Approach for Nomination of Personalized Treatment in Lung Cancer

Elizabeth A McMillan et al. Cell. .

Abstract

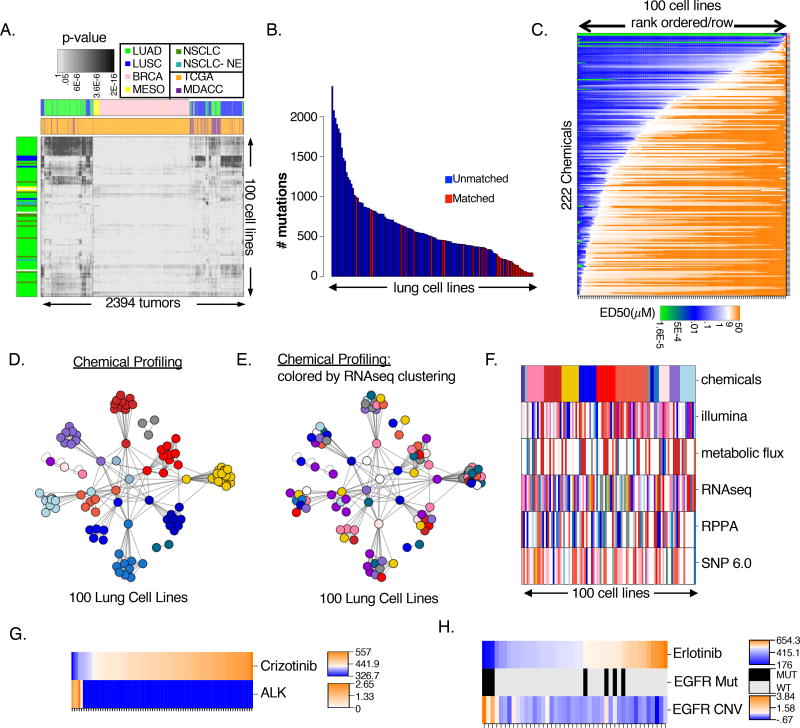
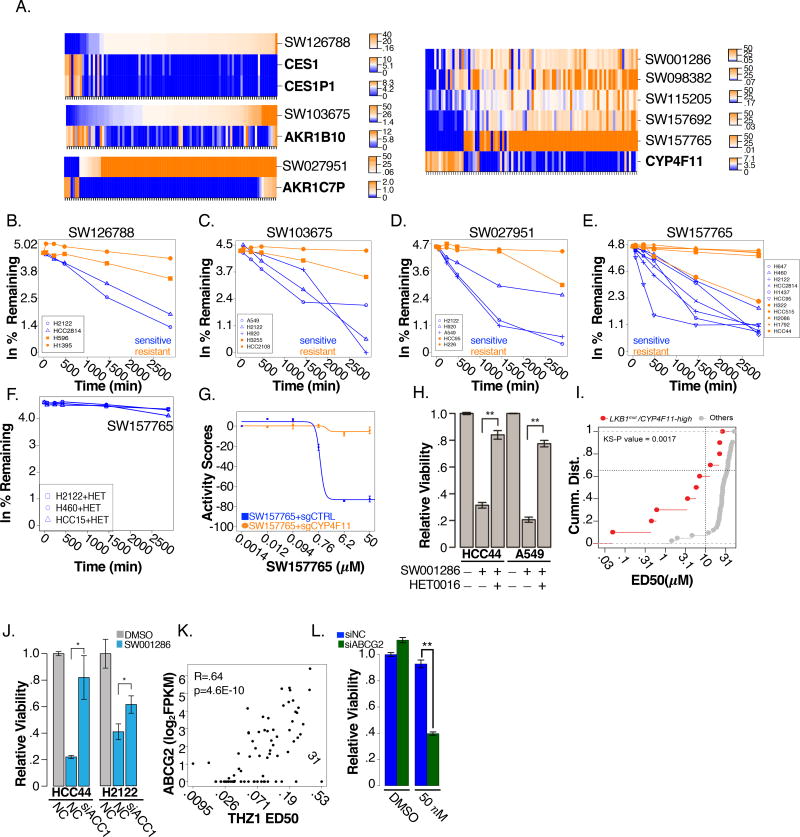
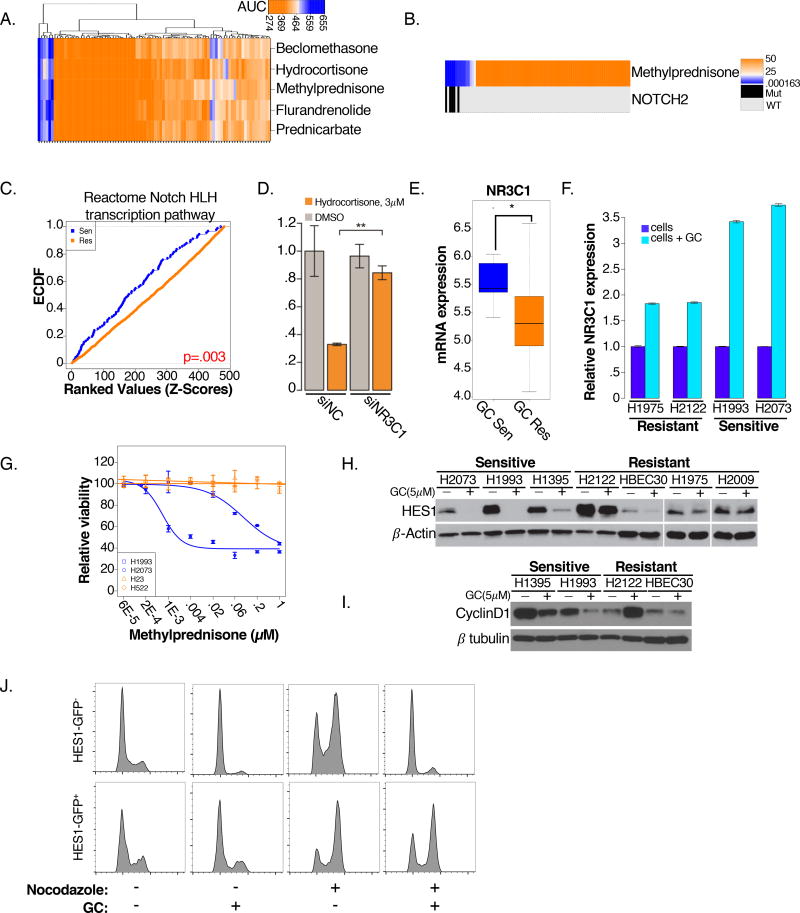
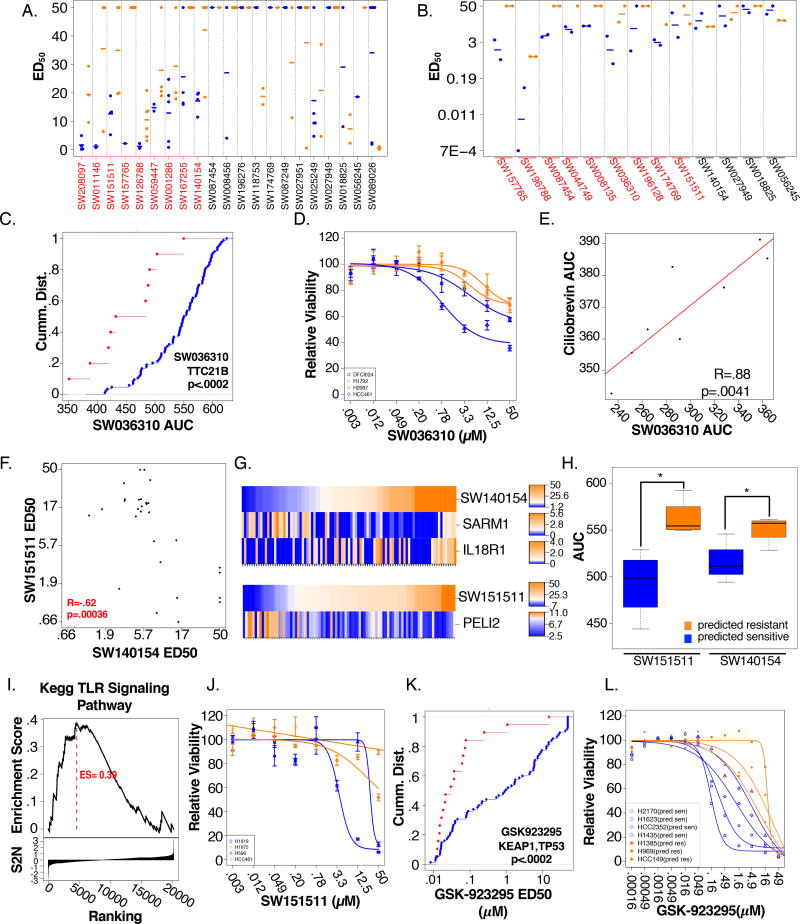
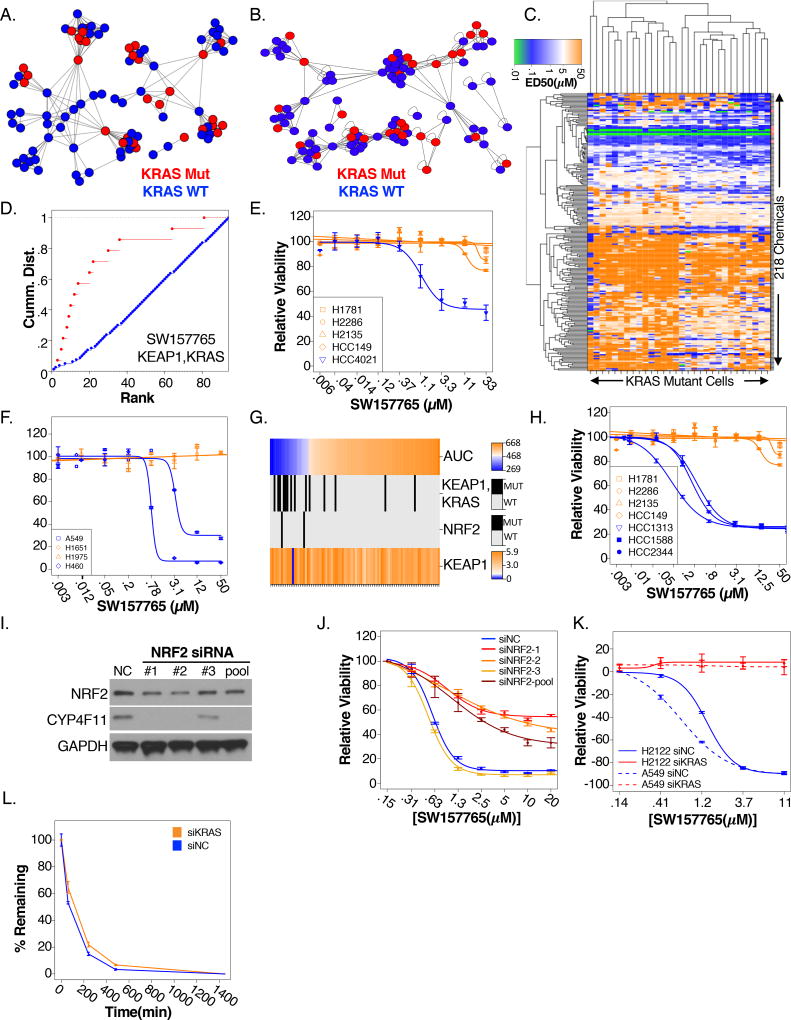
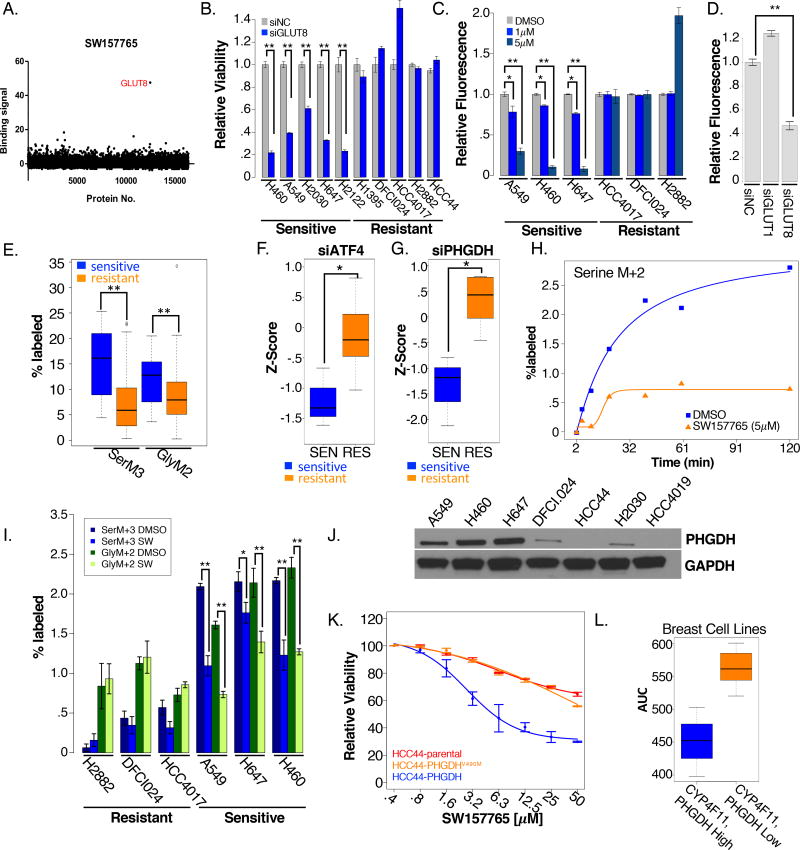
Diversity in the genetic lesions that cause cancer is extreme. In consequence, a pressing challenge is the development of drugs that target patient-specific disease mechanisms. To address this challenge, we employed a chemistry-first discovery paradigm for de novo identification of druggable targets linked to robust patient selection hypotheses. In particular, a 200,000 compound diversity-oriented chemical library was profiled across a heavily annotated test-bed of >100 cellular models representative of the diverse and characteristic somatic lesions for lung cancer. This approach led to the delineation of 171 chemical-genetic associations, shedding light on the targetability of mechanistic vulnerabilities corresponding to a range of oncogenotypes present in patient populations lacking effective therapy. Chemically addressable addictions to ciliogenesis in TTC21B mutants and GLUT8-dependent serine biosynthesis in KRAS/KEAP1 double mutants are prominent examples. These observations indicate a wealth of actionable opportunities within the complex molecular etiology of cancer.

Keywords: KRAS mutant; NRF2 signaling; cancer target identification; chemical biology; ciliogenesis; glucocorticoid therapies; lung cancer; serine biosynthesis.


Conflict of interest statement

Declaration of Interests

The authors have no conflicts of interest to report related to this work. Michael White is currently an employee of Pfizer Inc. and Takashi Motoyaji was an employee of Takeda Oncology.

Figures

Figure 1
Figure 1. Genomic characterization and chemical sensitivities of NSCLC cell line panel
(A) p-values (Pearson) comparing tumors (MDACC=orange; TCGA=purple) and cell lines colored by source (B) Number of mutations called in the matched (red) and unmatched (blue) subsets post-filtering (C) NSCLC sensitivity (ED50) to POPS rank ordered by row. Red dashes = ‘cherry-picked’ (D) APC clustering by similarity of POPs ED50 responses. Nodes are colored according to cluster membership (E) APC clustering by similarity of POPs ED50 responses (as in Figure 1D). Nodes are colored according to cluster membership defined by RNAseq based APC (Figure S1E) (F) APC clustering across all datasets. Cell lines are ordered according to cluster membership in chemical APC. Each cell line is colored according to cluster membership in the indicated datasets (Figure S1M–P). Cell lines absent from a dataset are colored in white (G–H) Predictive mRNA expression signatures specifying (G) crizotinib and (H) erlotinib sensitivity. Rank-ordered sensitivity values are indicated as heatmap (top row) with corresponding features plotted below. *all experiments performed in triplicate, unless otherwise indicated. Values are means. Error bars plotted as ± 1 SD. * p<.05; ** p<.01
Figure 2
Figure 2. Detecting “prodrugs” and drug efflux substrates
(A) Elastic net modeling associates mRNA expression of drug metabolism enzymes with sensitivity to 8 chemicals. Rank-ordered ED50 values are indicated as heatmap (SWxxxxxx; top row). Corresponding log2 FPKM values are plotted underneath (B–F) Percent remaining (ln scale) of (B) SW126788 (C) SW103675 (D) SW027951 (E) SW157765 and (F) SW157765 co-treated with HET-0016 (100 nM) is plotted as a function of chemical treatment time (blue = sensitive cell line; orange = resistant cell line). Values are normalized to control treatment (G) SW157765 dose response in H460 cells with and without deletion of CYP411 (H) Viability of cells treated with either DMSO, SW001286 (5µM) or co-treated with SW001286 (5µM) and HET-0016 (100nM) for 72 hrs (I) CDF plot comparing SW001286 sensitivity (ED50) of cell lines with high expression of CYP4F11 and LKB1 mutations (red) to wild-type cell lines (grey) (J) siRNA depletion of ACC1 or a non-targeting control (NC) followed by 72 hr SW001286 treatment (HCC44= 5µM; H2122=1µM). (K) THZ1 ED50 plotted as a function of ABCG2 mRNA expression (log2 FPKM). Pearson R=.64, p=4.6E-10 (L) siRNA depletion of ABCG2 or non-targeting control (NC) followed by 72 hrs THZ1 treatment (50nM) in H157 cells.
Figure 3
Figure 3. Glucocorticoid sensitivity is predicted by Notch2 mutations
(A) 2-way hierarchical cluster of 5 glucocorticoid AUC values across 100 NSCLC cell lines (B) Rank-ordered ED50 values for methylprednisone are indicated as heatmap (top row). Mutation status for NOTCH2 is shown below (C) CDF plot comparing ranked mRNA expression of genes in the indicated gene set (z-scores) in GC sensitive (blue) and resistant cell lines (orange; KS-test p=.003) (D) siRNA depletion of NR3C1 or a non-targeting control (NC) followed by 72 hrs hydrocortisone treatment (3µM) in H2073 cells. (E) Log2 mRNA expression of NR3C1 in GC responsive and non-responsive cell lines (illumina BeadArray) (F) Changes in NR3C1 mRNA 72 hrs post-GC treatment (5 µM) in 2 sensitive and resistant cell lines, normalized to untreated cells (G) Dose response curves of cell lines grown in 3D spheroid models in response to methylprednisone. Cell lines that were sensitive (blue) or resistant (orange) to GC’s in standard 2-D cell-culture were evaluated in 3D. (n=8/dose) (H–I) Changes in (H) HES1 and (I) Cyclin D1 protein expression 72 hrs post-GC treatment (5 µM) in sensitive and resistant cells (J) Flow cytometric histograms for H1993 cells transfected with HES1-pCMV-AC-GFP and treated 72 hrs post-GC treatment (5 µM). The propidium iodide signal of cells gated by GFP fluorescence is graphed. Nocodazole (100 ng/mL) was added 48 hrs post-treatment to force accumulation of proliferating cells in G2/M over the course of the next 24 hrs
Figure 4
Figure 4. Biological diversity among robust chemical/genetic associations
(A) ED50 values of the testing set cell lines predicted to be sensitive (blue) and resistant (orange) to each indicated chemical. Dashes indicate class means. Red font indicates chemicals with successfully predicted selectivity profiles (KS-test p-values <.05) (B) ED50 values of cell lines grown in 3D spheroid format in response to the indicated chemicals. Cell lines that were sensitive (blue) or resistant (orange) to each chemical in standard 2D cell-culture were evaluated. Dashes indicate class means. Chemicals for which 2D selectivity is preserved in 3D (KS-test p<.05) are highlighted in red (C) CDF plot comparing SW036310 sensitivity (AUC) of TTC21B mutant (red) to wild-type cell lines (blue). (Scanning KS p<.0002) (D) Dose response curves of cell lines grown in 3D spheroid models in response to SW036310. Cell lines that were sensitive (blue) or resistant (orange) to SW036310 in standard 2D cell-culture were evaluated (n=8/dose) (E) SW036310 sensitivity (AUC) plotted as a function of Ciliobrevin sensitivity (AUC). Pearson R = .88; p=.0041 (F) SW140154 sensitivity (ED50) plotted as a function of SW151511 sensitivity (ED50). Pearson R=−.62, p= .00036 (G) Predictive mRNA expression signature specifies sensitivity to SW140154 and SW151511. Rank ordered ED50 values are indicated as a heatmap (top row). Log2 FPKM values are plotted below (H) Cell line sensitivities outside the training set were predicted based on associated elastic net models of SW140154 and SW151511. Boxplot represents AUC values for each prediction class (Orange = predicted resistant, blue = predicted sensitive). (I) SW151511 responsive cells show enrichment of KEGG TLR Signaling compared to SW140154 non-responsive cell lines. (GSEA ES = .39) (J) Dose response curves of cell lines grown in 3D spheroid models in response to SW151511. Cell lines that were sensitive (blue) or resistant (orange) to SW151511 in standard 2-D cell-culture were evaluated. (n=8/dose) (K) CDF plot comparing GSK-923295 sensitivity (ED50) of cell lines with co-occurring mutations in TP53 and KEAP1 (red) to wild-type (blue). (Scanning KS p<.0002) (L) Dose-response curves for cell lines outside the training set predicted to be sensitive (blue) and resistant (orange) to GSK-923295
Figure 5
Figure 5. Chemical response associations among KRAS mutant NSCLC lines
(A–B) Cell lines clustered (APC) according to (A) similarity of ED50 responses to the “POPS” and (B) similarity of gene expression (RNAseq). Cell lines (nodes) are colored according to KRAS status (blue = KRAS mutant, red= KRAS WT) (C) 2-way hierarchical cluster of KRAS mutant cells according to response to POPs (ED50). Red = cherry-picked dataset (D) CDF plot comparing SW157765 sensitivity (AUC) of cell lines with co-occurring mutations in KRAS and KEAP1 (red) to wild-type (blue; p<.0002; KS-test) (E) Dose response curves of 5 cell lines not included in the original training panel in response to SW157765 (blue=KEAP1, KRAS mutant, orange = WT) (F) Dose response curves of cell lines grown in 3D spheroid models in response to SW157765. Cell lines that were sensitive (blue) or resistant (orange) to SW036310 in standard 2-D cell-culture were evaluated (n=8/dose) (G) Heatmaps relate SW157765 sensitivity to predictive biomarkers. Cell lines are ranked by response (AUC; top panel). For each cell line the co-occurrence of mutations in KEAP1 and KRAS, NRF2 mutations and RNAseq based log2 FPKM expression values for KEAP1 are shown below (H) Dose response curves in response to SW157765 of cell lines outside the training set with high (blue) and low (orange) mRNA expression of an NRF2 regulated gene signature (I) protein expression of NRF2 and CYP4F11 post-siRNA mediated depletion of NRF2 or a non-targeting control (NC). siNRF2 oligos were transfected individually or as a pool (J) siRNA mediated depletion of NRF2 or a non-targeting control (NC) followed by 72 hrs SW157765 treatment in A549 cells. Dose response curves are shown. siNRF2 oligos were individually transfected or transfected as a pool (K) siRNA mediated depletion of KRAS or a non-targeting control (NC) followed by 72 hrs SW157765 treatment in H2122 and A549 cells. Dose response curves are shown (n=6/dose) (L) The percent remaining of SW157765 in H2122 cells transfected with siKRAS (orange) or a non-targeting control (NC, blue) plotted as a function of chemical treatment time
Figure 6
Figure 6. SW157765 sensitive cell lines define a KRAS mechanistic subtype addicted to GLUT8 mediated glucose transport
(A) LC/MS binding signals for ~14,000 proteins tested for the ability to bind to SW157765. (B) siRNA mediated depletion of GLUT8 (blue) or a non-targeting control (grey; NC) in SW157765 sensitive and resistant cell lines. (C) Cellular accumulation of fluorescently labeled 2DG in sensitive and resistant cell lines 72 hrs post-SW157765 treatment (purple= 1µM; blue = 5µM) or DMSO treatment. (D) Cellular accumulation of fluorescently labeled 2DG in H647 (KEAP1, KRAS mutant) cells post-siRNA depletion of GLUT1 and GLUT8 (E) Incorporation of [13C6] into serine (SerM3) and glycine carbons (GlyM2) in SW157765 sensitive (n=12) and resistant (n=57) cell lines at 24 hours post-label incubation (F–G) Relative viability (z-scores) of SW157765 sensitive and resistant cells in response to (F) siATF4 (G) and siPHGDH (H) Incorporation of [13C6] into serine (SerM2) in H647 cells 24 hrs post-SW157765 or DMSO treatment (I) Incorporation of [13C6] into serine (SerM3) and glycine (GlyM2) carbons in SW157765 sensitive and resistant cells 6 hrs post-SW157765 or DMSO treatment (J) Protein expression of PHGDH in KEAP1, KRAS mutant, SW157765 sensitive cell lines (A549, H460, and H647) and KEAP1, KRAS mutant unanticipated non-responders (DFCI024, HCC44, H2030, HCC4019) (K) Dose response curves of HCC44 cells and HCC44 cells stably expressing either PHGDH or PHGDHV490M in response to SW157765 (L) SW157765 response (AUC) in CYP4F11 and PHDGH positive breast cancer cell lines (blue) compared to CYP4F11, PHGDH negative cell lines (orange)

Comment in

Similar articles

Cited by

References

    1. Barretina J, Caponigro G, Stransky N, Venkatesan K, Margolin AA, Kim S, Wilson CJ, Lehar J, Kryukov GV, Sonkin D, et al. The Cancer Cell Line Encyclopedia enables predictive modelling of anticancer drug sensitivity. Nature. 2012;483:603–607. - PMC - PubMed
    1. Baumgart A, Mazur PK, Anton M, Rudelius M, Schwamborn K, Feuchtinger A, Behnke K, Walch A, Braren R, Peschel C, et al. Opposing role of Notch1 and Notch2 in a Kras(G12D)-driven murine non-small cell lung cancer model. Oncogene. 2015;34:578–588. - PubMed
    1. Carayannopoulos MO, Chi MM, Cui Y, Pingsterhaus JM, McKnight RA, Mueckler M, Devaskar SU, Moley KH. GLUT8 is a glucose transporter responsible for insulin-stimulated glucose uptake in the blastocyst. Proc Natl Acad Sci U S A. 2000;97:7313–7318. - PMC - PubMed
    1. Chorley BN, Campbell MR, Wang X, Karaca M, Sambandan D, Bangura F, Xue P, Pi J, Kleeberger SR, Bell DA. Identification of novel NRF2-regulated genes by ChIP-Seq: influence on retinoid X receptor alpha. Nucleic Acids Res. 2012;40:7416–7429. - PMC - PubMed
    1. Chu D, Zhang Z, Zhou Y, Wang W, Li Y, Zhang H, Dong G, Zhao Q, Ji G. Notch1 and Notch2 have opposite prognostic effects on patients with colorectal cancer. Ann Oncol. 2011;22:2440–2447. - PubMed

Publication types

MeSH terms

Substances