

Combining electrical stimulation and tissue engineering to treat large bone defects in a rat model
- PMID: 29679025
- PMCID: PMC5910383
- DOI: 10.1038/s41598-018-24892-0
Combining electrical stimulation and tissue engineering to treat large bone defects in a rat model
Abstract
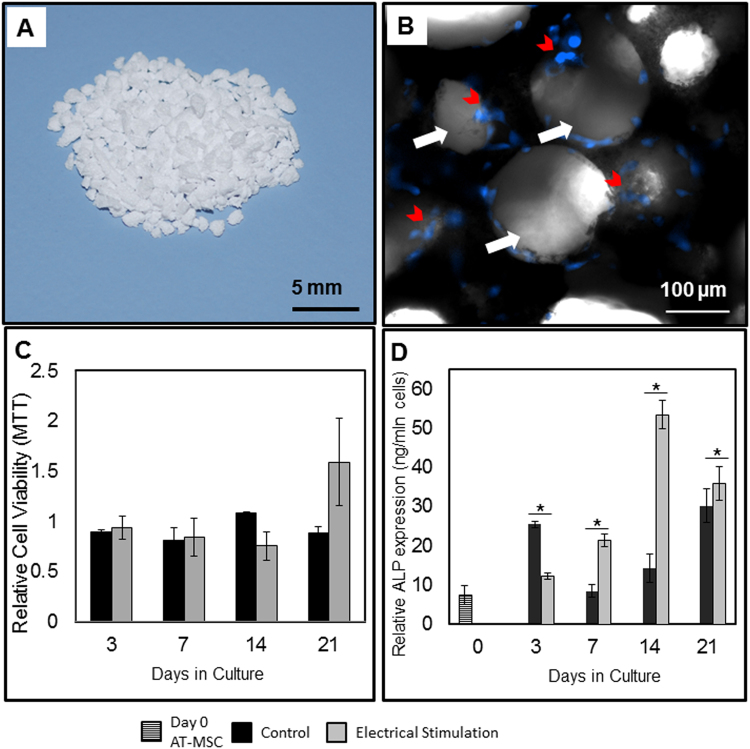
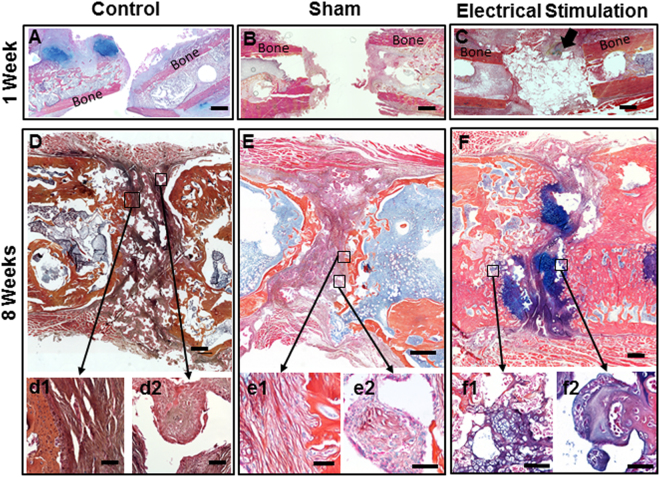
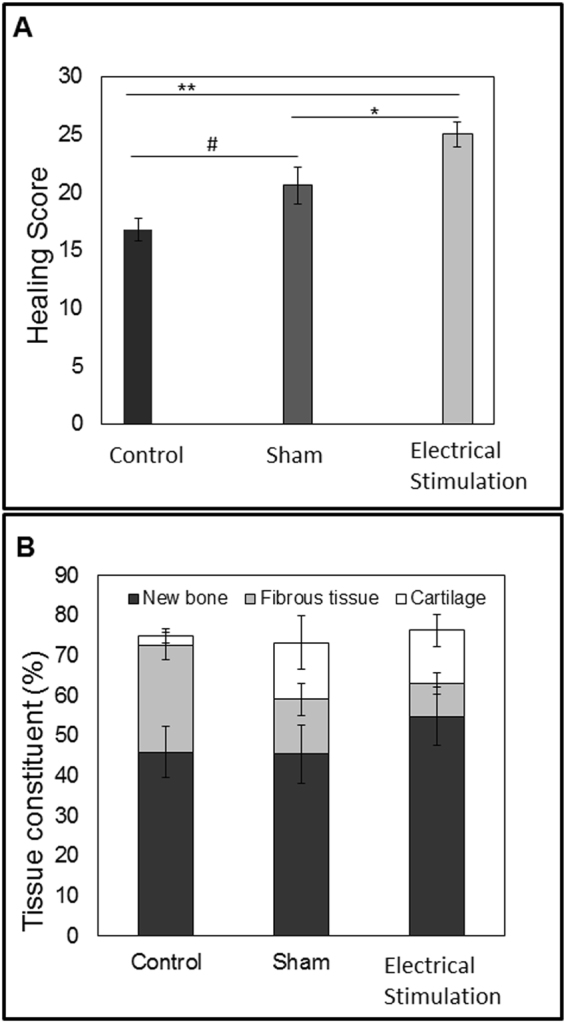
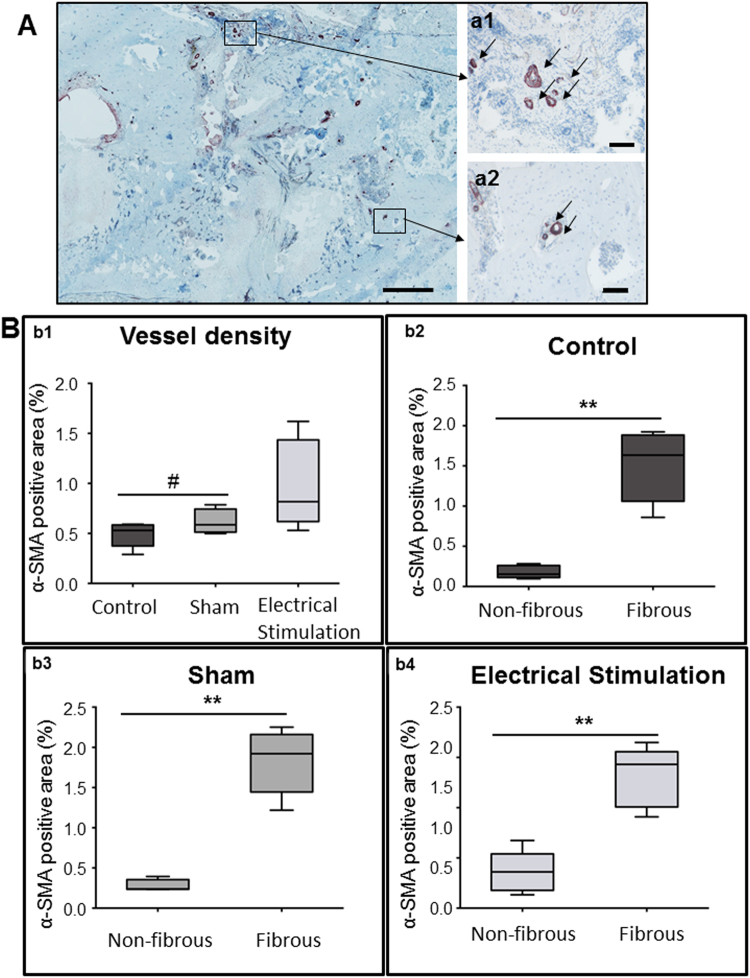
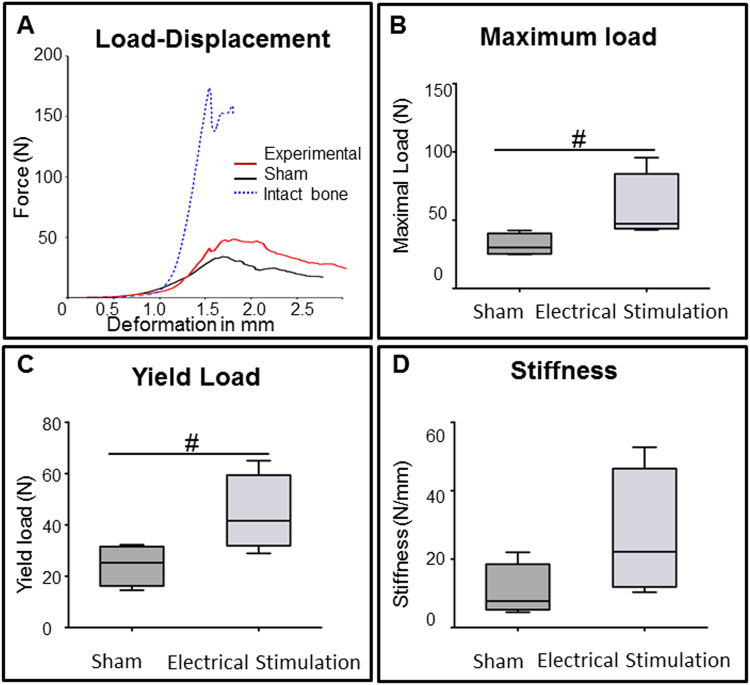
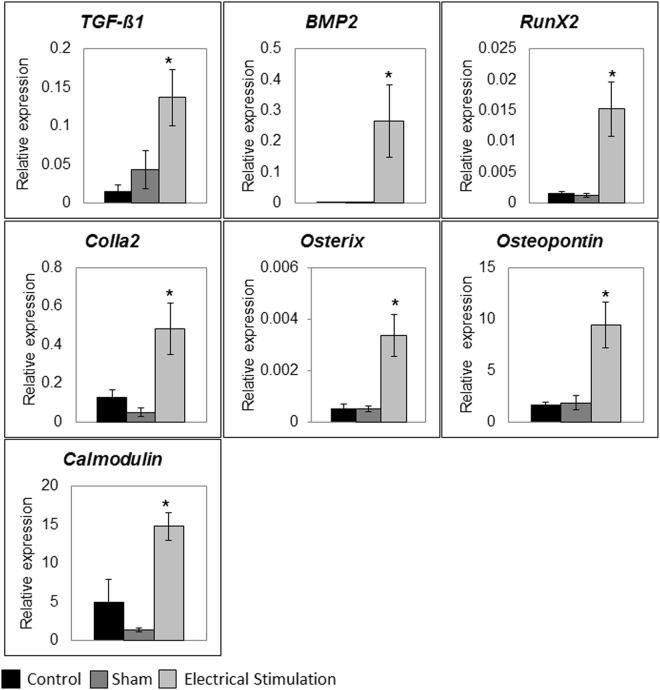
Bone Tissue engineering (BTE) has recently been introduced as an alternative to conventional treatments for large non-healing bone defects. BTE approaches mimic autologous bone grafts, by combining cells, scaffold, and growth factors, and have the added benefit of being able to manipulate these constituents to optimize healing. Electrical stimulation (ES) has long been used to successfully treat non-healing fractures and has recently been shown to stimulate bone cells to migrate, proliferate, align, differentiate, and adhere to bio compatible scaffolds, all cell behaviors that could improve BTE treatment outcomes. With the above in mind we performed in vitro experiments and demonstrated that exposing Mesenchymal Stem Cells (MSC) + scaffold to ES for 3 weeks resulted in significant increases in osteogenic differentiation. Then in in vivo experiments, for the first time, we demonstrated that exposing BTE treated rat femur large defects to ES for 8 weeks, caused improved healing, as indicated by increased bone formation, strength, vessel density, and osteogenic gene expression. Our results demonstrate that ES significantly increases osteogenic differentiation in vitro and that this effect is translated into improved healing in vivo. These findings support the use of ES to help BTE treatments achieve their full therapeutic potential.
Conflict of interest statement
The authors declare no competing interests.
Figures


Similar articles
-
The effect of autologous bone marrow stromal cells differentiated on scaffolds for canine tibial bone reconstruction.Biotech Histochem. 2015;90(7):516-28. doi: 10.3109/10520295.2014.983547. Epub 2015 May 21. Biotech Histochem. 2015. PMID: 25994048
-
Guided bone regeneration in pig calvarial bone defects using autologous mesenchymal stem/progenitor cells - a comparison of different tissue sources.J Craniomaxillofac Surg. 2012 Jun;40(4):310-20. doi: 10.1016/j.jcms.2011.05.004. Epub 2011 Jun 30. J Craniomaxillofac Surg. 2012. PMID: 21723141
-
Electrical stimulation in bone tissue engineering treatments.Eur J Trauma Emerg Surg. 2020 Apr;46(2):231-244. doi: 10.1007/s00068-020-01324-1. Epub 2020 Feb 20. Eur J Trauma Emerg Surg. 2020. PMID: 32078704 Free PMC article. Review.
-
Pretreatment of Mesenchymal Stem Cells with Electrical Stimulation as a Strategy to Improve Bone Tissue Engineering Outcomes.Cells. 2023 Aug 26;12(17):2151. doi: 10.3390/cells12172151. Cells. 2023. PMID: 37681884 Free PMC article.
-
Clinical Applications of Cell-Scaffold Constructs for Bone Regeneration Therapy.Cells. 2021 Oct 8;10(10):2687. doi: 10.3390/cells10102687. Cells. 2021. PMID: 34685667 Free PMC article. Review.
Cited by
-
Recent Advances in Mechanically Loaded Human Mesenchymal Stem Cells for Bone Tissue Engineering.Int J Mol Sci. 2020 Aug 13;21(16):5816. doi: 10.3390/ijms21165816. Int J Mol Sci. 2020. PMID: 32823645 Free PMC article. Review.
-
Implantable electrical stimulation bioreactor with liquid crystal polymer-based electrodes for enhanced bone regeneration at mandibular large defects in rabbit.Med Biol Eng Comput. 2020 Feb;58(2):383-399. doi: 10.1007/s11517-019-02046-2. Epub 2019 Dec 18. Med Biol Eng Comput. 2020. PMID: 31853774
-
Direct electrical stimulation enhances osteogenesis by inducing Bmp2 and Spp1 expressions from macrophages and preosteoblasts.Biotechnol Bioeng. 2019 Dec;116(12):3421-3432. doi: 10.1002/bit.27142. Epub 2019 Sep 23. Biotechnol Bioeng. 2019. PMID: 31429922 Free PMC article.
-
Conductive Polymeric-Based Electroactive Scaffolds for Tissue Engineering Applications: Current Progress and Challenges from Biomaterials and Manufacturing Perspectives.Int J Mol Sci. 2021 Oct 26;22(21):11543. doi: 10.3390/ijms222111543. Int J Mol Sci. 2021. PMID: 34768972 Free PMC article. Review.
-
Direct coupled electrical stimulation towards improved osteogenic differentiation of human mesenchymal stem/stromal cells: a comparative study of different protocols.Sci Rep. 2024 Mar 5;14(1):5458. doi: 10.1038/s41598-024-55234-y. Sci Rep. 2024. PMID: 38443455 Free PMC article.
References
-
- Giannoudis PV, Atkins R. Management of long-bone non-unions. Injury. 2007;38(Suppl 2):S1–2. - PubMed
Publication types
MeSH terms
LinkOut - more resources
Full Text Sources
Other Literature Sources
