Elimination of established tumors with nanodisc-based combination chemoimmunotherapy
- PMID: 29675465
- PMCID: PMC5906077
- DOI: 10.1126/sciadv.aao1736
Elimination of established tumors with nanodisc-based combination chemoimmunotherapy
Erratum in
-
Erratum for the Research Article: "Elimination of established tumors with nanodisc-based combination chemoimmunotherapy" by Kuai et al.Sci Adv. 2024 Aug 9;10(32):eadr9883. doi: 10.1126/sciadv.adr9883. Epub 2024 Aug 9. Sci Adv. 2024. PMID: 39121232 Free PMC article. No abstract available.
Abstract
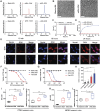
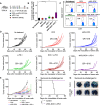
Although immune checkpoint blockade has shown initial success for various cancers, only a small subset of patients benefits from this therapy. Some chemotherapeutic drugs have been reported to induce antitumor T cell responses, prompting a number of clinical trials on combination chemoimmunotherapy. However, how to achieve potent immune activation with traditional chemotherapeutics in a manner that is safe, effective, and compatible with immunotherapy remains unclear. We show that high-density lipoprotein-mimicking nanodiscs loaded with doxorubicin (DOX), a widely used chemotherapeutic agent, can potentiate immune checkpoint blockade in murine tumor models. Delivery of DOX via nanodiscs triggered immunogenic cell death of cancer cells and exerted antitumor efficacy without any overt off-target side effects. "Priming" tumors with DOX-carrying nanodiscs elicited robust antitumor CD8+ T cell responses while broadening their epitope recognition to tumor-associated antigens, neoantigens, and intact whole tumor cells. Combination chemoimmunotherapy with nanodiscs plus anti-programmed death 1 therapy induced complete regression of established CT26 and MC38 colon carcinoma tumors in 80 to 88% of animals and protected survivors against tumor recurrence. Our work provides a new, generalizable framework for using nanoparticle-based chemotherapy to initiate antitumor immunity and sensitize tumors to immune checkpoint blockade.
Figures


Similar articles
-
Modulation of the tumor microenvironment by intratumoral administration of IMO-2125, a novel TLR9 agonist, for cancer immunotherapy.Int J Oncol. 2018 Sep;53(3):1193-1203. doi: 10.3892/ijo.2018.4456. Epub 2018 Jun 27. Int J Oncol. 2018. PMID: 29956749
-
High-Density Lipoprotein-Mimicking Nanodiscs for Chemo-immunotherapy against Glioblastoma Multiforme.ACS Nano. 2019 Feb 26;13(2):1365-1384. doi: 10.1021/acsnano.8b06842. Epub 2019 Feb 11. ACS Nano. 2019. PMID: 30721028 Free PMC article.
-
Dual pH-sensitive nanodrug blocks PD-1 immune checkpoint and uses T cells to deliver NF-κB inhibitor for antitumor immunotherapy.Sci Adv. 2020 Feb 5;6(6):eaay7785. doi: 10.1126/sciadv.aay7785. eCollection 2020 Feb. Sci Adv. 2020. PMID: 32076650 Free PMC article.
-
Application of Bionanomaterials in Tumor Immune Microenvironment Therapy.J Immunol Res. 2021 Feb 10;2021:6663035. doi: 10.1155/2021/6663035. eCollection 2021. J Immunol Res. 2021. PMID: 33628850 Free PMC article. Review.
-
Tumor Microenvironment-Activatable Prodrug Vesicles for Nanoenabled Cancer Chemoimmunotherapy Combining Immunogenic Cell Death Induction and CD47 Blockade.Adv Mater. 2019 Apr;31(14):e1805888. doi: 10.1002/adma.201805888. Epub 2019 Feb 14. Adv Mater. 2019. PMID: 30762908 Review.
Cited by
-
The application of nanodiscs in membrane protein drug discovery & development and drug delivery.Front Chem. 2024 Sep 18;12:1444801. doi: 10.3389/fchem.2024.1444801. eCollection 2024. Front Chem. 2024. PMID: 39359422 Free PMC article. Review.
-
Multifunctional nanocomposites modulating the tumor microenvironment for enhanced cancer immunotherapy.Bioact Mater. 2023 Sep 6;31:440-462. doi: 10.1016/j.bioactmat.2023.08.022. eCollection 2024 Jan. Bioact Mater. 2023. PMID: 37701452 Free PMC article. Review.
-
Induction of anti-cancer T cell immunity by in situ vaccination using systemically administered nanomedicines.Cancer Lett. 2019 Sep 10;459:192-203. doi: 10.1016/j.canlet.2019.114427. Epub 2019 Jun 8. Cancer Lett. 2019. PMID: 31185250 Free PMC article. Review.
-
Lipid-based nanoparticles for treatment of cancer.Heliyon. 2022 May 13;8(5):e09403. doi: 10.1016/j.heliyon.2022.e09403. eCollection 2022 May. Heliyon. 2022. PMID: 35663739 Free PMC article. Review.
-
Biomimetic Nanotechnology toward Personalized Vaccines.Adv Mater. 2020 Apr;32(13):e1901255. doi: 10.1002/adma.201901255. Epub 2019 Jun 17. Adv Mater. 2020. PMID: 31206841 Free PMC article. Review.
References
-
- Hodi F. S., O’Day S. J., McDermott D. F., Weber R. W., Sosman J. A., Haanen J. B., Gonzalez R., Robert C., Schadendorf D., Hassel J. C., Akerley W., van den Eertwegh A. J., Lutzky J., Lorigan P., Vaubel J. M., Linette G. P., Hogg D., Ottensmeier C. H., Lebbé C., Peschel C., Quirt I., Clark J. I., Wolchok J. D., Weber J. S., Tian J., Yellin M. J., Nichol G. M., Hoos A., Urba W. J., Improved survival with ipilimumab in patients with metastatic melanoma. N. Engl. J. Med. 363, 711–723 (2010). - PMC - PubMed
-
- Robert C., Schachter J., Long G. V., Arance A., Grob J. J., Mortier L., Daud A., Carlino M. S., McNeil C., Lotem M., Larkin J., Lorigan P., Neyns B., Blank C. U., Hamid O., Mateus C., Shapira-Frommer R., Kosh M., Zhou H., Ibrahim N., Ebbinghaus S., Ribas A.; KEYNOTE-006 investigators , Pembrolizumab versus ipilimumab in advanced melanoma. N. Engl. J. Med. 372, 2521–2532 (2015). - PubMed
-
- Garon E. B., Rizvi N. A., Hui R., Leighl N., Balmanoukian A. S., Eder J. P., Patnaik A., Aggarwal C., Gubens M., Horn L., Carcereny E., Ahn M. J., Felip E., Lee J. S., Hellmann M. D., Hamid O., Goldman J. W., Soria J. C., Dolled-Filhart M., Rutledge R. Z., Zhang J., Lunceford J. K., Rangwala R., Lubiniecki G. M., Roach C., Emancipator K., Gandhi L., Pembrolizumab for the treatment of non–small-cell lung cancer. N. Engl. J. Med. 372, 2018–2028 (2015). - PubMed
-
- Rosenberg J. E., Hoffman-Censits J., Powles T., van der Heijden M. S., Balar A. V., Necchi A., Dawson N., O’Donnell P. H., Balmanoukian A., Loriot Y., Srinivas S., Retz M. M., Grivas P., Joseph R. W., Galsky M. D., Fleming M. T., Petrylak D. P., Perez-Gracia J. L., Burris H. A., Castellano D., Canil C., Bellmunt J., Bajorin D., Nickles D., Bourgon R., Frampton G. M., Cui N., Mariathasan S., Abidoye O., Fine G. D., Dreicer R., Atezolizumab in patients with locally advanced and metastatic urothelial carcinoma who have progressed following treatment with platinum-based chemotherapy: A single-arm, multicentre, phase 2 trial. Lancet 387, 1909–1920 (2016). - PMC - PubMed
-
- Topalian S. L., Hodi F. S., Brahmer J. R., Gettinger S. N., Smith D. C., McDermott D. F., Powderly J. D., Carvajal R. D., Sosman J. A., Atkins M. B., Leming P. D., Spigel D. R., Antonia S. J., Horn L., Drake C. G., Pardoll D. M., Chen L., Sharfman W. H., Anders R. A., Taube J. M., McMiller T. L., Xu H., Korman A. J., Jure-Kunkel M., Agrawal S., McDonald D., Kollia G. D., Gupta A., Wigginton J. M., Sznol M., Safety, activity, and immune correlates of anti–PD-1 antibody in cancer. N. Engl. J. Med. 366, 2443–2454 (2012). - PMC - PubMed
Publication types
MeSH terms
Substances
Grants and funding
LinkOut - more resources
Full Text Sources
Other Literature Sources
Research Materials

