

RNA sensor LGP2 inhibits TRAF ubiquitin ligase to negatively regulate innate immune signaling
- PMID: 29661858
- PMCID: PMC5989757
- DOI: 10.15252/embr.201745176
RNA sensor LGP2 inhibits TRAF ubiquitin ligase to negatively regulate innate immune signaling
Abstract
The production of type I interferon (IFN) is essential for cellular barrier functions and innate and adaptive antiviral immunity. In response to virus infections, RNA receptors RIG-I and MDA5 stimulate a mitochondria-localized signaling apparatus that uses TRAF family ubiquitin ligase proteins to activate master transcription regulators IRF3 and NFκB, driving IFN and antiviral target gene expression. Data indicate that a third RNA receptor, LGP2, acts as a negative regulator of antiviral signaling by interfering with TRAF family proteins. Disruption of LGP2 expression in cells results in earlier and overactive transcriptional responses to virus or dsRNA LGP2 associates with the C-terminus of TRAF2, TRAF3, TRAF5, and TRAF6 and interferes with TRAF ubiquitin ligase activity. TRAF interference is independent of LGP2 ATP hydrolysis, RNA binding, or its C-terminal domain, and LGP2 can regulate TRAF-mediated signaling pathways in trans, including IL-1β, TNFα, and cGAMP These findings provide a unique mechanism for LGP2 negative regulation through TRAF suppression and extend the potential impact of LGP2 negative regulation beyond the IFN antiviral response.
Keywords: TRAF; LGP2; RIG‐I‐like receptors; innate immunity; interferon.
© 2018 The Authors.
Figures
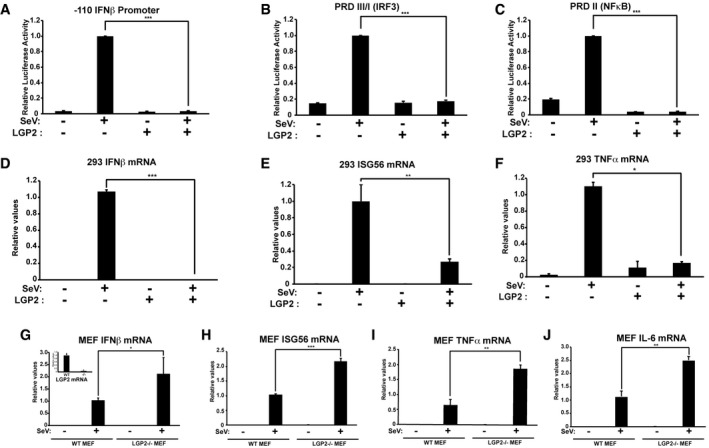
HEK293 cells were transfected with IFNβ promoter reporter gene and 500 ng LGP2 expression plasmid (+) or salmon sperm DNA (−), then infected with 200 HA units per ml of SeV for 6 h prior to luciferase assays.
Similar to (A), but using PRDIII/I (IRF3) reporter gene.
Similar to (A), but using PRDII (NFκB) reporter gene.
Cells were transfected with empty vector (−) or 500 ng LGP2 expression plasmid (+), then stimulated with 200 HA units per ml of SeV for 8 h prior to RNA isolation and RT–qPCR with IFNβ‐specific primers or control GAPDH.
Similar to (D), but using primers for ISG56.
Similar to (D), but using primers for TNFα.
Using WT and LGP2−/− MEFs, mRNA was isolated after 4 h SeV infection and subjected to RT–qPCR with murine IFNβ‐specific primers or control GAPDH. Inset graph illustrates LGP2 mRNA level to verify knockout.
Similar to (G), but using primers for ISG56.
Similar to (G), but using primers for TNFα.
Similar to (G), but using primers for IL‐6.
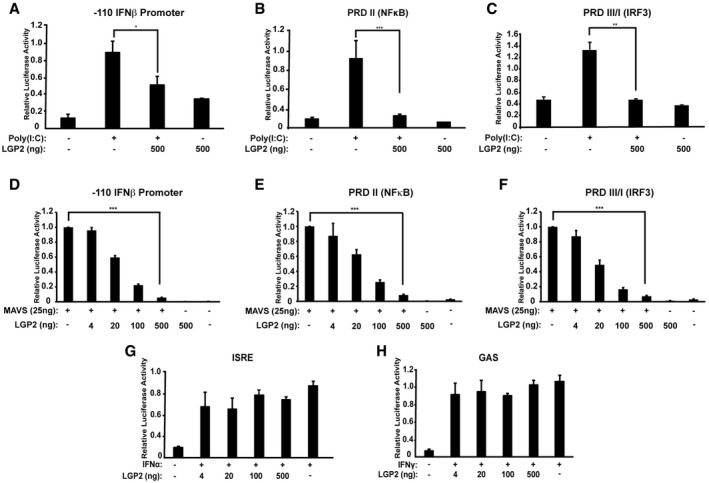
IFNβ‐reporter gene assay with 6 h poly(I:C) (5 μg/ml) stimulation with or without LGP2 expression. 2fTGH cells were harvested for luciferase assays.
Similar to (A), but using PRDII (NFκB) reporter gene.
Similar to (A), but using PRDIII/I (IRF3) reporter gene.
IFNβ‐reporter gene assay with MAVS expressed with or without LGP2 titration. Cells were harvested 24 h post‐transfection for luciferase assays.
Similar to (D), but using PRDII (NFκB) reporter gene.
Similar to (D), but using PRDIII/I (IRF3) reporter gene.
ISRE‐reporter gene assay with 6‐h IFNα stimulation with or without LGP2 titration.
GAS‐reporter gene assay with 6‐h IFNγ stimulation with or without LGP2 titration.
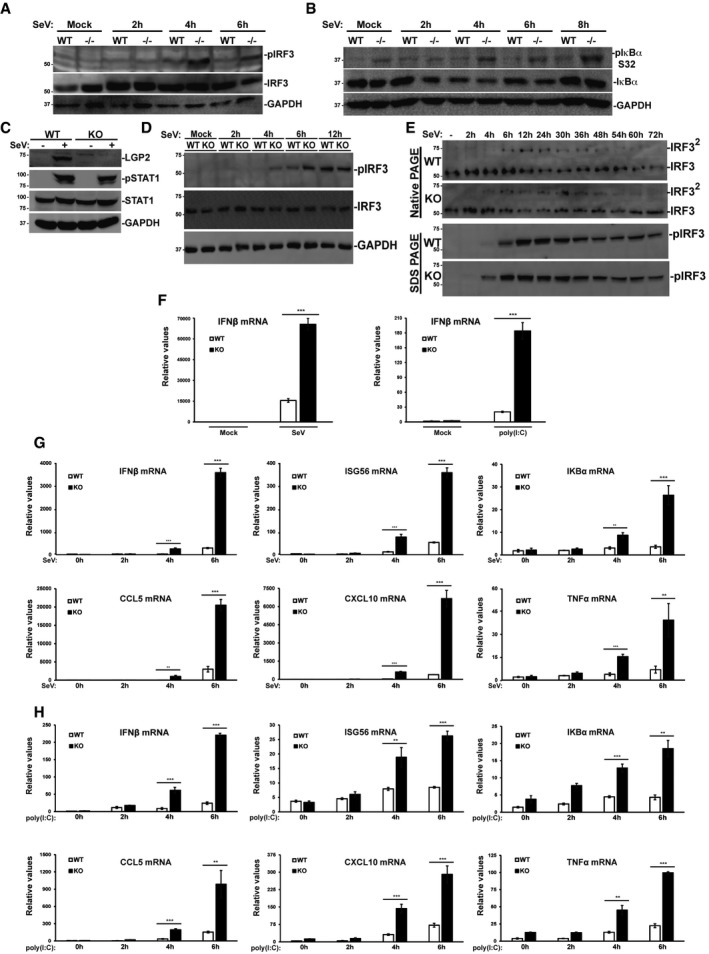
WT and LGP2−/− MEFs were stimulated with 200 HA units per ml of SeV at indicated time points, and cell lysates were subjected to immunoblotting with antibodies that recognize phospho‐IRF3 (S396), total IRF3, and GAPDH.
Similar to (A), but probing with antibodies for phospho‐IκBα (S32), total IκBα, and GAPDH.
Immunoblot of WT and LGP2‐deficient (KO) HEK293 cells. Cells were mock‐infected (−) or infected with SeV (+) for 24 h prior to analysis of LGP2, STAT1 phosphotyrosine 701 (pSTAT1), total STAT1, and control GAPDH.
WT and LGP2 KO cells were subjected to a time course of SeV infection prior to analysis of IRF3 phosphorylation at S396 (pIRF3).
Similar to (D), but lysates were subjected to native PAGE to detect IRF3 dimerization (IRF32), and to SDS–PAGE to detect IRF3 S396 phosphorylation (pIRF3).
WT and LGP2 KO cells were infected with SeV for 24 h or treated with poly(I:C) for 6 h. RNA was isolated and subjected to RT–qPCR with IFNβ‐specific primers or control GAPDH.
WT and LGP2 KO cells were subjected to a time course of SeV infection prior to RNA isolation and RT–qPCR.
Similar to (G), except cells were treated with poly(I:C).
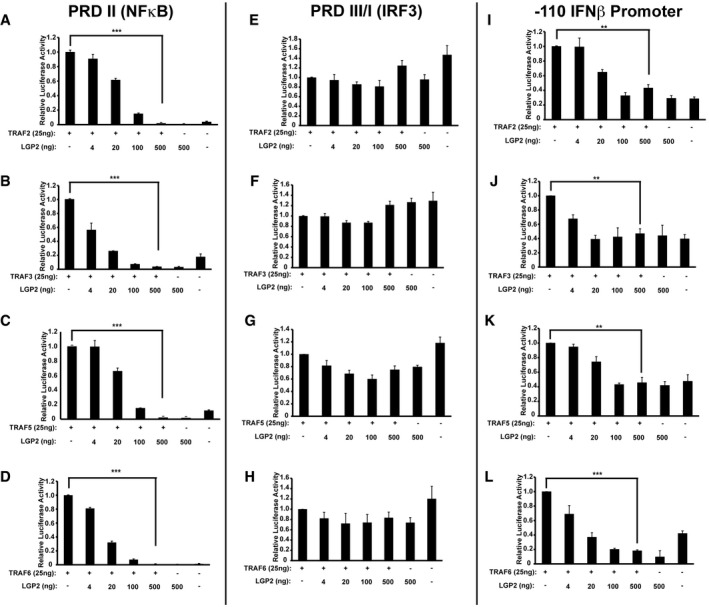
- A–D
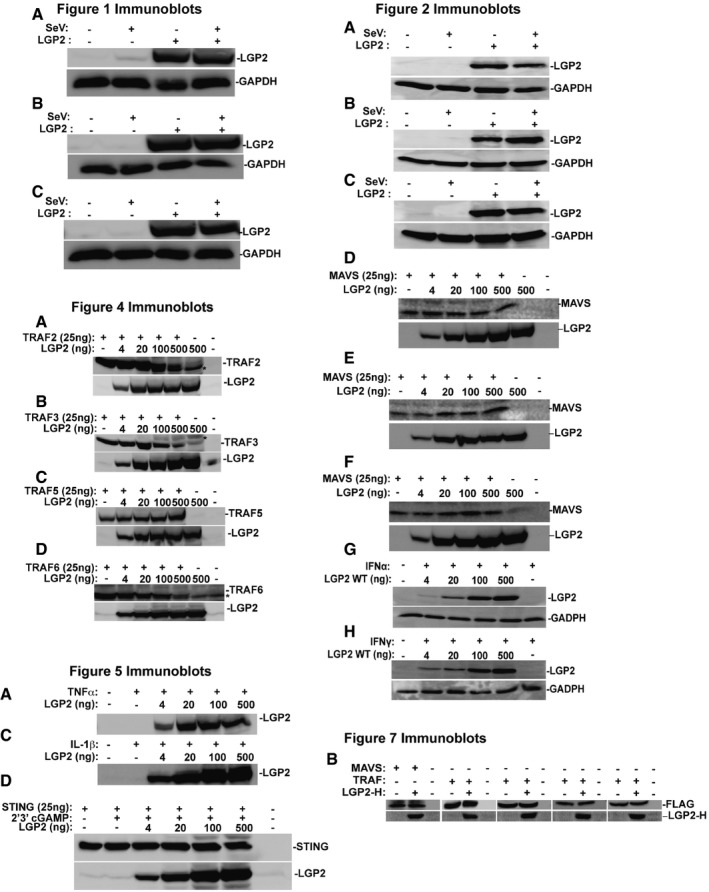
PRD II (NFκB)‐reporter gene assays with TRAF2, TRAF3, TRAF5, or TRAF6 expressed with or without LGP2 titration. Cells were harvested 24 h post‐transfection for luciferase assays. Bars represent average values (n = 3) with ± standard deviation. Corresponding immunoblots in Fig EV1.
- E–H
Similar to (A), but using PRDIII/I (IRF3) reporter gene.
- I–L
Similar to (A), but using ‐110 IFNβ‐ promoter reporter gene.
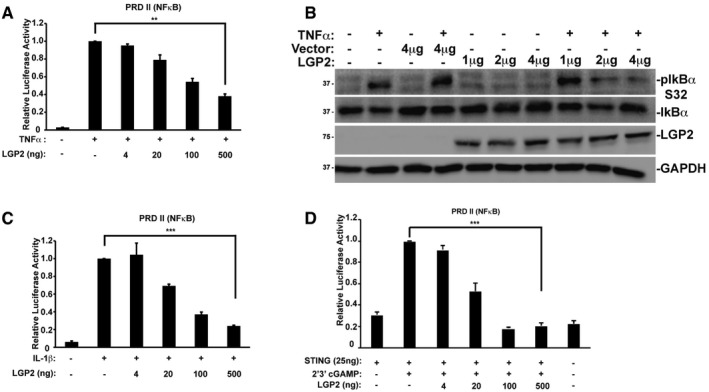
NFκB‐reporter gene assay with HEK293 cells treated (+) for 6 h with TNFα (10 ng/ml) with or without LGP2 plasmid titration as indicated. Bars represent average values (n = 3) ± standard deviation. Corresponding immunoblots in Fig EV1.
HeLa cells transfected with indicated amounts of LGP2 or empty vector were treated with TNFα (10 ng/ml) for 5 min. Cell lysates were subjected to immunoblotting with antibodies that recognize phospho‐IκBα (ser32), total IκBα, FLAG‐tagged LGP2, and GAPDH.
Similar to (A), but treating HEK293 cells with IL‐1β (10 ng/ml)
Similar to (A), but STING was co‐transfected with indicated amounts of the LGP2 plasmid prior to stimulation with 2′3′ cGAMP (20 μg/ml) for 24 h in HEK293 cells.
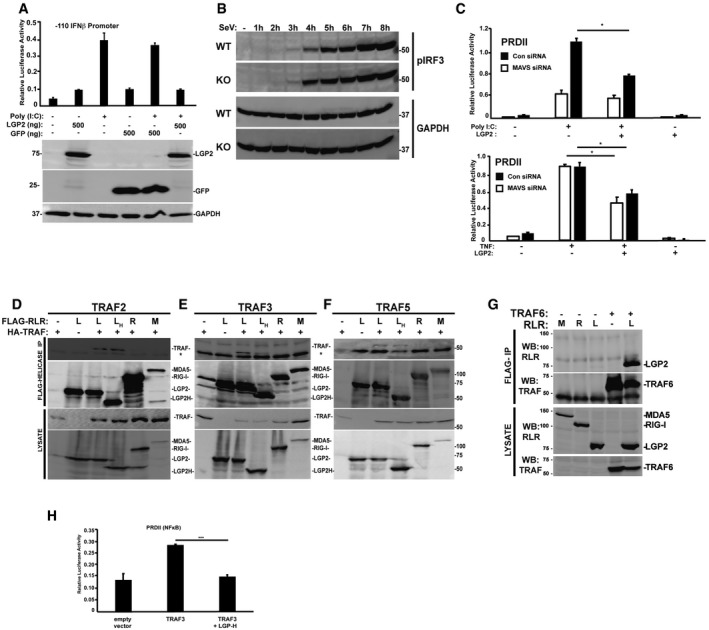
IFNβ‐reporter gene assay in HEK293 cells treated (+) for 6 h with poly(I:C) (5 μg/ml) with or without LGP2 and GFP plasmid titration as indicated. Bars represent average values (n = 3) ± standard deviation.
WT and LGP2 KO cells were subjected to an hourly time course of SeV infection prior to analysis of IRF3 phosphorylation at S396 (pIRF3).
NFκB‐reporter gene assay in HEK293 cells that were transfected with MAVS siRNA or non‐targeting control (Con) siRNA and plasmids expressing FLAG‐tagged LGP2 for 48 h. Cells were then stimulated for 6 h with either poly(I:C) (5 μg/ml) or TNFα (10 ng/ml). Bars represent average values (n = 2) with ± standard deviation. *P ≤ 0.05 by two‐tailed Student's t‐test.
Cells were transfected with plasmids expressing FLAG‐tagged LGP2 (L), LGP2‐H (H), RIG‐I (R), and MDA5 (M) and HA‐tagged TRAF2 as indicated. Cell lysates were subjected to FLAG immunoaffinity purification and immunoblotting with antisera for FLAG (RLR Helicases) and HA (TRAF2) (n = 3). Asterisk (*) denotes non‐specific cross‐reactivity.
Similar to (D), but using HA‐tagged TRAF3 (n = 3).
Similar to (D), but using HA‐tagged TRAF5 (n = 3).
Cells were transfected with plasmids expressing HA‐tagged MDA5 (M), RIG‐I (R), LGP2 (L), and FLAG‐Vector (−) as indicated. Cell lysates were subjected to FLAG immunoaffinity purification and immunoblotting with antisera for FLAG (TRAF) and HA (LGP2) (n = 3).
Plot of TRAF3 inhibition by LGP2‐H from Fig 7B without mathematical normalization.
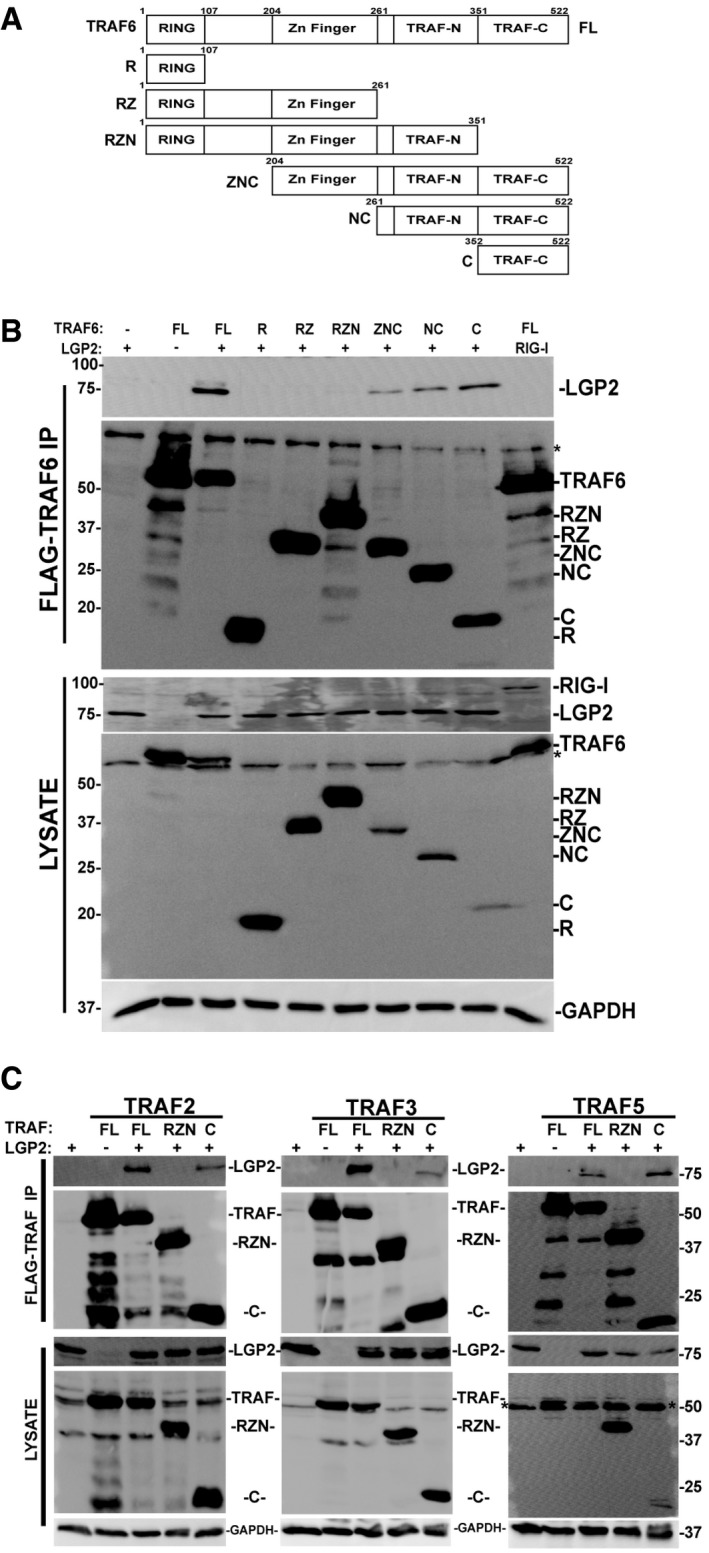
Diagram illustrating the domain structure of full‐length TRAF6 and the fragments generated for this study.
Cells were transfected with FLAG‐tagged full‐length TRAF6 or TRAF6 fragments along with HA‐tagged LGP2, and lysates were subjected to FLAG immunoaffinity purification and detection of co‐precipitation was carried out by anti‐HA immunoblot for LGP2 (or RIG‐I as a control), anti‐FLAG immunoblot for TRAF6, and anti‐GAPDH control (n = 5). * indicates non‐specific cross‐reactivity.
Similar to (B), testing the interaction with full‐length, N‐ and C‐terminal truncations of TRAF2, TRAF3, and TRAF5 with LGP2. All full‐length TRAFs and their C‐terminal domains co‐precipitate LGP2. * indicates non‐specific cross‐reactivity (n = 3 for all experiments).
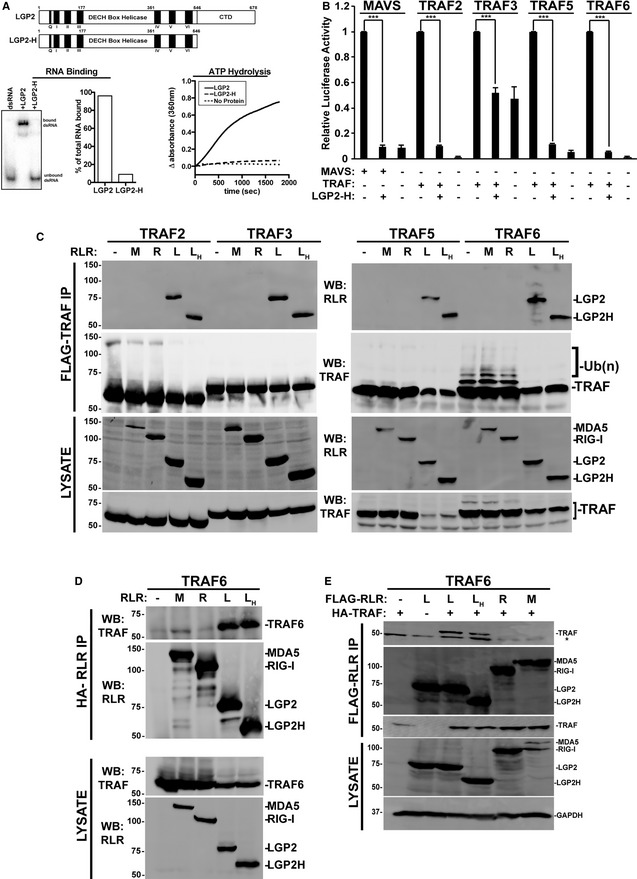
Diagram illustrating the domain structure of full‐length LGP2 and LGP2‐H (top). Analysis of LGP2‐H catalytic properties. RNA binding was tested by mobility shift assay and quantified by phosphor imaging (bottom left). ATP hydrolysis was directly measured for both proteins at 100 nM (bottom right).
NFκB‐reporter gene assay with MAVS or indicated TRAFs expressed with or without LGP2‐H. Cells were harvested 24 h post‐transfection prior to luciferase assays. Bars represent normalized mean values (n = 3) ± standard deviation. ***P ≤ 0.0005 by two‐tailed Student's t‐test. Corresponding immunoblots in Fig EV1.
Cells were transfected with plasmids expressing HA‐tagged MDA5 (M), RIG‐I (R), LGP2 (L), LGP2‐H (LH) and FLAG‐tagged TRAF2, 3, 5, and 6 as indicated (n = 3). Cell lysates were subjected to FLAG immunoaffinity purification and immunoblotting with antisera for FLAG (TRAF) and HA (LGP2).
Reverse co‐immunoprecipitation. Similar to (C), except cell lysates were subjected to HA immunoprecipitation and immunoblotting with antisera for FLAG (TRAF6) and HA (LGP2).
Reverse co‐immunoprecipitation. Similar to (C), except cells were transfected with plasmids expressing HA‐tagged TRAF6 and FLAG‐tagged RLRs as indicated. Cell lysates were subjected to FLAG immunoaffinity purification and immunoblotting with antisera for FLAG (RLR) and HA (TRAF6) (n = 3). Asterisk (*) indicates non‐specific cross‐reactivity.
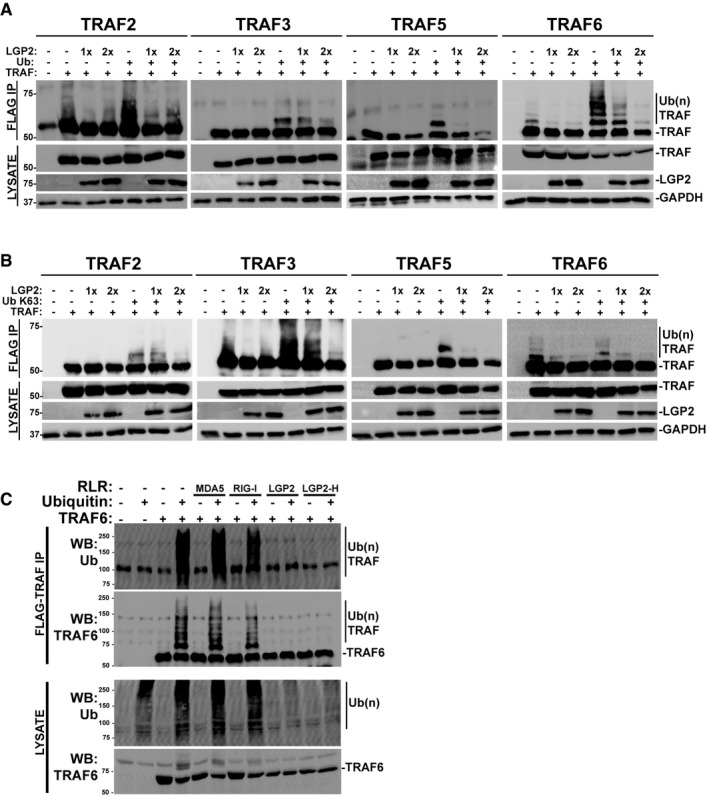
Cells were transfected with plasmids expressing HA‐tagged LGP2, FLAG‐tagged TRAF2, 3, 5, 6, and ubiquitin (Ub) as indicated (n = 3). Cell lysates were subjected to FLAG immunoaffinity purification and immunoblotting with antisera for FLAG (TRAF), LGP2, and GAPDH.
Similar to (A), but using K63‐only variant of ubiquitin (Ub K63) (n = 3).
Cells were transfected with plasmids expressing HA‐tagged MDA5, RIG‐I, LGP2, LGP2‐H, FLAG‐tagged TRAF6, and ubiquitin (Ub) as indicated. Cell lysates were subjected to FLAG immunoaffinity purification and immunoblotting with antisera for FLAG (TRAF) and ubiquitin (n = 3).
Similar articles
-
Spatiotemporal dynamics of innate immune signaling via RIG-I-like receptors.Proc Natl Acad Sci U S A. 2020 Jul 7;117(27):15778-15788. doi: 10.1073/pnas.1921861117. Epub 2020 Jun 22. Proc Natl Acad Sci U S A. 2020. PMID: 32571931 Free PMC article.
-
The RIG-I-like receptor LGP2 inhibits Dicer-dependent processing of long double-stranded RNA and blocks RNA interference in mammalian cells.EMBO J. 2018 Feb 15;37(4):e97479. doi: 10.15252/embj.201797479. Epub 2018 Jan 19. EMBO J. 2018. PMID: 29351913 Free PMC article.
-
LGP2 binds to PACT to regulate RIG-I- and MDA5-mediated antiviral responses.Sci Signal. 2019 Oct 1;12(601):eaar3993. doi: 10.1126/scisignal.aar3993. Sci Signal. 2019. PMID: 31575732
-
LGP2 synergy with MDA5 in RLR-mediated RNA recognition and antiviral signaling.Cytokine. 2015 Aug;74(2):198-206. doi: 10.1016/j.cyto.2015.02.010. Epub 2015 Mar 18. Cytokine. 2015. PMID: 25794939 Free PMC article. Review.
-
Sensing of viral nucleic acids by RIG-I: from translocation to translation.Eur J Cell Biol. 2012 Jan;91(1):78-85. doi: 10.1016/j.ejcb.2011.01.015. Epub 2011 Apr 14. Eur J Cell Biol. 2012. PMID: 21496944 Free PMC article. Review.
Cited by
-
Proofreading mechanisms of the innate immune receptor RIG-I: distinguishing self and viral RNA.Biochem Soc Trans. 2024 Jun 26;52(3):1131-1148. doi: 10.1042/BST20230724. Biochem Soc Trans. 2024. PMID: 38884803 Free PMC article. Review.
-
Function conservation and disparities of zebrafish and human LGP2 genes in fish and mammalian cells responsive to poly(I:C).Front Immunol. 2022 Aug 17;13:985792. doi: 10.3389/fimmu.2022.985792. eCollection 2022. Front Immunol. 2022. PMID: 36059486 Free PMC article.
-
m6A Methylation in Regulation of Antiviral Innate Immunity.Viruses. 2024 Apr 13;16(4):601. doi: 10.3390/v16040601. Viruses. 2024. PMID: 38675942 Free PMC article. Review.
-
Spatiotemporal dynamics of innate immune signaling via RIG-I-like receptors.Proc Natl Acad Sci U S A. 2020 Jul 7;117(27):15778-15788. doi: 10.1073/pnas.1921861117. Epub 2020 Jun 22. Proc Natl Acad Sci U S A. 2020. PMID: 32571931 Free PMC article.
-
LGP2 is essential for zebrafish survival through dual regulation of IFN antiviral response.iScience. 2022 Jul 30;25(8):104821. doi: 10.1016/j.isci.2022.104821. eCollection 2022 Aug 19. iScience. 2022. PMID: 35982787 Free PMC article.
References
Publication types
MeSH terms
Substances
Grants and funding
LinkOut - more resources
Full Text Sources
Other Literature Sources
Medical
Research Materials
