. 2018 Apr 13;14(4):e1006973.
doi: 10.1371/journal.ppat.1006973. eCollection 2018 Apr.

Limited immune surveillance in lymphoid tissue by cytolytic CD4+ T cells during health and HIV disease

Affiliations

Limited immune surveillance in lymphoid tissue by cytolytic CD4+ T cells during health and HIV disease

Marcus Buggert et al. PLoS Pathog. .

Abstract

CD4+ T cells subsets have a wide range of important helper and regulatory functions in the immune system. Several studies have specifically suggested that circulating effector CD4+ T cells may play a direct role in control of HIV replication through cytolytic activity or autocrine β-chemokine production. However, it remains unclear whether effector CD4+ T cells expressing cytolytic molecules and β-chemokines are present within lymph nodes (LNs), a major site of HIV replication. Here, we report that expression of β-chemokines and cytolytic molecules are enriched within a CD4+ T cell population with high levels of the T-box transcription factors T-bet and eomesodermin (Eomes). This effector population is predominately found in peripheral blood and is limited in LNs regardless of HIV infection or treatment status. As a result, CD4+ T cells generally lack effector functions in LNs, including cytolytic capacity and IFNγ and β-chemokine expression, even in HIV elite controllers and during acute/early HIV infection. While we do find the presence of degranulating CD4+ T cells in LNs, these cells do not bear functional or transcriptional effector T cell properties and are inherently poor to form stable immunological synapses compared to their peripheral blood counterparts. We demonstrate that CD4+ T cell cytolytic function, phenotype, and programming in the peripheral blood is dissociated from those characteristics found in lymphoid tissues. Together, these data challenge our current models based on blood and suggest spatially and temporally dissociated mechanisms of viral control in lymphoid tissues.


Conflict of interest statement

The authors have declared that no competing interests exist.

Figures

Fig 1
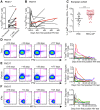
Fig 1. Cytolytic CD4+ T cells express high levels of T-bet and Eomes in blood.
(A) Representative flow cytometry plots of Granzyme B and perforin expression in CD4+ T cells for an HIV-infected and–uninfected subject. The distribution of Granzyme B+perforin+ (red) and Granzyme B-perforin- (blue) CD4+ T cells are shown for T-bet and Eomes expression. (B) Frequency of perforin+ CD4+ T cells within the T-bethiEomes+ and T-betdim/- population (left) and T-bethiEomes+ within the perforin+ or perforin- population for HIV-infected and–uninfected subjects. (C) Correlation between the frequency of perforin+ and T-bethi CD4+ T cells. (D) Imagestream analysis on T-bethi and T-betdim CD4+ T cells. Overlays of fluorescent channels for DAPI (nuclear) and T-bet, showing where in the cells T-bet are localized. The frequency of nuclear, nuclear/cytoplasmic and cytoplasmic localization for T-bethi and T-betdim CD4+ T cells are shown in the before-after graphs. (E) tSNE plots based on 30,000 live CD4+ T cells that were merged from three HIV-uninfected subjects with detectable cytolytic CD4+ T cells. The tSNE clustering is based on CD45RO, CD27, CCR7, T-bet, Eomes, Granzyme A, Granzyme B and perforin expression intensity. The red gate indicates the identified “effector” cluster with overlapped expression of cytolytic markers as well as T-bet and Eomes. (F) Flow plots of MIP-1α production using media (NC) and aCD3-CD28 stimulations for T-bethi and Eomes+ CD4+ T cells, as well as correlation between the frequency of T-bethiEomes+ and MIP-1α+ CD4+ T cells following aCD3-CD28 stimulations. Median and IQR are shown for all scatter plots and Mann-Whitney tests were performed to compare differences between groups; ***P < 0.001. A non-parametric Spearman test was used for the correlations analysis. All data are derived from the North-American cohort.
Fig 2
Fig 2. Temporal dynamics of T-bethi expression and effector HIV-specific CD4+ T cell responses following HIV infection in blood.
(A) Frequencies of T-bethi CD4+ T cells before and first sample taken 1 year after HIV infection (n = 10). (B) Longitudinal changes of T-bethi CD4+ T cells before and subsequently after HIV infection. Every individual is depicted with black connecting lines and red line indicate the estimated mean value (linear regression) over time (n = 10). (C) Frequency of T-bethi expression on memory CD4+ T cells in HIV- and HIV+ chronic progressors (CP) (D) T-bet, (E) perforin and (F) MIP-1α expression by IFNγ+ Gag-specific CD4+ T cells before and subsequently following HIV infection (n = 10). The colored lines represent each subject and their frequencies of T-bethi, perforin+ and MIP-1α+ Gag-specific CD4+ T cells over time. A Wilcoxon or Mann-Whitney test was performed to compare the difference between groups; *P < 0.05. Longitudinal data-points are derived from the RV217 cohort and cross-sectional data from the European cohort.
Fig 3
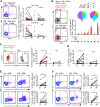
Fig 3. Phenotypic, cytolytic and transcriptional differences between LN and blood CD4+ T cells in HIV-infected and -uninfected individuals.
(A) Flow cytometry plots (HIV-infected CP) and scatter plots for naïve and memory subsets of LN and peripheral blood (PB) CD4+ T cells in HIV-infected and -uninfected subjects. (B) Flow cytometry plots (HIV-infected CP) showing the lack of T-bethiEomes+ CD4+ T cells in LNs. Corresponding scatter plots demonstrating the frequency of T-bethi cells of memory (non-naïve) CD4+ T cells (top) and frequency of Eomes+ cells of T-bethi CD4+ T cells (bottom) for matched LN and PB. (C) Flow plots (HIV-infected CP) showing the lack of Granzyme B+perforin+ CD4+ T cells in LNs and scatter plots with the frequency of LN and PB perforin+ cells of memory CD4+ T cells (top). Frequencies of Granzyme B+ cells of perforin+ CD4+ T cells (bottom) for matched LN and PB. (D) Flow plots (HIV-infected CP) and scatter plots showing the distribution of CD27+ cells within the Granzyme B+ CD4+ T cell compartment for matched LN and PB. (E) The distribution of different populations in the tSNE space is based on 30.000 live CD4+ T cells that were merged from LN and PB from a HIV-infected CP with detectable levels of cytolytic cells in the PB and LN Tfh cells. The tSNE clustering is based on CD45RO, CD27, CCR7, T-bet, Eomes, Granzyme B, perforin, CXCR5 and PD-1 expression on gated bulk CD4+ T cells. The naïve cluster (green) is based on high CCR7 and low CD45RO intensity; the Tfh cluster (red) on high intensity of PD-1 and CXCR5; and the effector cluster (orange) on high T-bet and perforin expression intensity. After separating out the merged LN and PB single CD4+ T cell data, a lack of Tfh cells was apparent in PB and effector CD4+ T cells in the LN (lower right tSNE plots). Median and IQR are shown for all scatter plots. Mann-Whitney tests were performed to compare differences between two unmatched groups, and Wilcoxon matched-pairs single rank tests between matched samples; *P < 0.05, **P < 0.01 and ***P < 0.001. All data-points are derived from the North-American and Mexico cohort.
Fig 4
Fig 4. Functional characteristics of polyclonal and virus-specific effector CD4+ T cell responses in HIV-infected LNs and blood.
(A) Flow cytometry plots (HIV ART+ subject) and plots for matched HIV-Gag or–Env-specific CD4+ T cell responses in HIV-infected LN and PB. (B) Flow cytometry plots (HIV-infected CP) showing the negative control (NC) and Gag-specific response of LN CD4+ T cell response. The high abundance of CD107a (red) that is not co-expressed with IFNγ or TNF is illustrated in this example. SPICE analysis of functional combination between LN (red) and PB (red-gray) Gag-specific CD4+ T cell responses for HIV-infected CPs and ART+ subjects. (C) Flow plots (HIV-infected CP) of Gag-specific CD4+ T cell response (red) from LN and PB in relation to CD27 and perforin expression. Graphs represent the frequency of (C) perforin+ and (D) T-bethi cells between LN and PB Gag-specific CD4+ T cells. (E) Flow plots (HIV-infected CP) of MIP-1α versus IFNγ and TNF production for LN and PB SEB stimulated CD4+ T cells. Corresponding plots showing the frequency of MIP-1α+ SEB stimulated CD4+ T cells (top) and MIP-1α+ of IFNγ/TNF/CD107a/MIP-1α+ SEB stimulated CD4+ T cells (bottom). (F) Flow plots (HIV-infected CP) of MIP-1α versus IFNγ and TNF production for LN and PB CMV-specific CD4+ T cells and corresponding graphs showing the frequency of MIP-1α+ CMV-specific CD4+ T cells (top) and MIP-1α+ of IFNγ/TNF/CD107a/MIP-1α+ CMV-specific CD4+ T cells (bottom). Median and IQR are shown for all bar plots. Permutation test was performed between the pie charts. Wilcoxon matched-pairs single rank tests were performed to compare differences between two matched groups; *P < 0.05, **P < 0.01 and ***P < 0.001. All data-points are derived from the Mexico cohort.
Fig 5
Fig 5. Expression of effector molecules by Gag-specific CD4+ T cells from HIV elite controller LNs and blood.
(A) Flow cytometry plots (HIV elite controllers) illustrating the distribution of LN (red) and PB (blue) IFNγ+ Gag-specific CD4+ T cell responses between the T-betdimEomes- and T-bethiEomes+ compartment. Corresponding scatterplots showing the frequencies of T-betdimEomes- (left) and T-bethiEomes+ (right) cells of Gag-specific CD4+ T cells between LN and PB for HIV elite controllers. Flow plots (HIV elite controllers) of IFNγ+ Gag-specific CD4+ T cell response from LN and PB in relation to (B) perforin and (C) MIP-1α expression. Graphs represent the frequency of (B) perforin+ and (C) MIP-1α+ Gag-specific CD4+ T cells between LN and PB. (D) Flow plots and graphs demonstrating the expression pattern of perforin+Granzyme B+ memory CD4+ T cells in acute/early seroconverters (left graph). Right graphs show the frequency perforin+Granzyme B+ or T-bet expression out of total memory Ki-67+ CD4+ T cells. Median and IQR are shown for all scatter plots. Mann-Whitney tests were performed to compare differences between groups; *P < 0.05, **P < 0.01 and ***P < 0.001. All data-points are derived from the North-American cohort.
Fig 6
Fig 6. Functional and transcriptional differences between degranulating cells in LN and blood.
(A) Flow cytometry plots (HIV-uninfected subject) of matched LN and PB CD107a+ SEB stimulated CD4+ T cell responses. Graphs are showing the frequencies of LN (top) and PB (bottom) CD107a+ SEB stimulated CD4+ T cell responses for CXCR5-, CXCR5+ and CXCR5hi cells. (B) Flow plots (HIV-infected CP) illustrating the expression of CD107a+ (red) Gag-specific CD4+ T cells in relation to CXCR5 between LN (top) and PB (bottom). (C) Corresponding plots from the same subject showing the expression of CD107a+ (red) Gag-specific CD4+ T cells in relation to CXCR5 and perforin for LN (top) and PB (bottom). Graphs represent the frequency of CD107a+ cells within the CXCR5+, CXCR5hi and perforin+ compartment for LN (top) and PB (bottom) Gag-specific CD4+ T cells. (D) Biomark analysis illustrating the tSNE distribution of single SEB stimulated CD107+ CD4+ T cells from LN (black) and PB (gray). Individual graphs represent the relative Log2 expression of different markers being significantly different (P<0.05) between blood and LN CD107+ cells. Non-parametric Kruskal Wallis test with Dunn’s multiple comparison test was performed to determine significant differences between groups; *P < 0.05, **P < 0.01 and ***P < 0.001. All data-points are derived from the North-American and Mexico cohort.
Fig 7
Fig 7. Synaptic interface, degranulation pattern and kinetics of degranulation by LN and blood CD4+ T cells.
Freshly isolated CD4+ T cells were exposed to planar lipid bilayers containing fluorescent labeled ICAM-1 and anti-CD3 antibodies and the structure of the T cell/bilayer interface and pattern and kinetics of degranulation were analyzed by TIRF microscopy. (A) Representative images of T cell/bilayer interface demonstrating patterns of accumulation and segregation of TCR and integrin molecules and the appearance of CD107a proteins at the interface are shown. The cells fall into 4 different groups: 1) T cells demonstrating the formation of classical cytolytic synapse containing central (cSMAC) domain, peripheral ring junction (pSMAC), and centrally located CD107a indicating granule release (solid red); 2) T cells showing the formation of cytolytic synapse without detectable granule release (solid blue); 3) T cells that are characterized by aggregation of TCR and integrin molecules without formation of mature cytolytic synapse, but with detectable granule release (red stripes); 4) T cells that display overlapping aggregates of TCR and integrin molecules without granule release (blue stripes). (B) Diagrams showing representation of LN- and PB-derived T cells of HIV-infected ART- and uninfected individuals with different structure of synaptic interfaces and patterns of granule release displayed in panel (A); HIV-specific cloned CD4+ T cells AC25 are shown for comparison reasons. (C) Time-dependent changes of the structure of T cell/bilayer interfaces and appearance of the released granules for representative T cells derived from LN and PB are shown. (D) Quantitation of the kinetics of granule release by LN (closed circles) and PB (open circles) CD4+ T cells isolated from HIV-infected ART- (red circles) and uninfected (black circles) individuals. The kinetics of granule release by HIV-specific T-cell clone AC25 is shown for comparison reasons (depicted by open blue circles). Each individual circle designates first appearance of detectable granule release by individual cells. Median and IQR are shown for all scatter plots. Mann-Whitney tests were performed to compare differences between indicated groups of T cells; *P < 0.05, **P < 0.01.

Similar articles

Cited by

References

    1. Cheroutre H, Husain MM. CD4 CTL: living up to the challenge. Semin Immunol. 2013;25(4):273–81. doi: 10.1016/j.smim.2013.10.022 ; PubMed Central PMCID: PMCPMC3886800. - DOI - PMC - PubMed
    1. Brown DM. Cytolytic CD4 cells: Direct mediators in infectious disease and malignancy. Cell Immunol. 2010;262(2):89–95. doi: 10.1016/j.cellimm.2010.02.008 ; PubMed Central PMCID: PMCPMC2874968. - DOI - PMC - PubMed
    1. Buggert M, Norstrom MM, Czarnecki C, Tupin E, Luo M, Gyllensten K, et al. Characterization of HIV-specific CD4+ T cell responses against peptides selected with broad population and pathogen coverage. PloS one. 2012;7(7):e39874 Epub 2012/07/14. doi: 10.1371/journal.pone.0039874 ; PubMed Central PMCID: PMC3390319. - DOI - PMC - PubMed
    1. Ferre AL, Hunt PW, McConnell DH, Morris MM, Garcia JC, Pollard RB, et al. HIV controllers with HLA-DRB1*13 and HLA-DQB1*06 alleles have strong, polyfunctional mucosal CD4+ T-cell responses. J Virol. 2010;84(21):11020–9. doi: 10.1128/JVI.00980-10 ; PubMed Central PMCID: PMCPMC2953185. - DOI - PMC - PubMed
    1. Kaufmann DE, Bailey PM, Sidney J, Wagner B, Norris PJ, Johnston MN, et al. Comprehensive analysis of human immunodeficiency virus type 1-specific CD4 responses reveals marked immunodominance of gag and nef and the presence of broadly recognized peptides. J Virol. 2004;78(9):4463–77. Epub 2004/04/14. doi: 10.1128/JVI.78.9.4463-4477.2004 ; PubMed Central PMCID: PMC387674. - DOI - PMC - PubMed

Publication types