. 2018 Jun 4;217(6):2005-2018.
doi: 10.1083/jcb.201708137. Epub 2018 Apr 12.

Mechanotransduction via the LINC complex regulates DNA replication in myonuclei

Affiliations

Mechanotransduction via the LINC complex regulates DNA replication in myonuclei

Shuoshuo Wang et al. J Cell Biol. .

Abstract

Nuclear mechanotransduction has been implicated in the control of chromatin organization; however, its impact on functional contractile myofibers is unclear. We found that deleting components of the linker of nucleoskeleton and cytoskeleton (LINC) complex in Drosophila melanogaster larval muscles abolishes the controlled and synchronized DNA endoreplication, typical of nuclei across myofibers, resulting in increased and variable DNA content in myonuclei of individual myofibers. Moreover, perturbation of LINC-independent mechanical input after knockdown of β-Integrin in larval muscles similarly led to increased DNA content in myonuclei. Genome-wide RNA-polymerase II occupancy analysis in myofibers of the LINC mutant klar indicated an altered binding profile, including a significant decrease in the chromatin regulator barrier-to-autointegration factor (BAF) and the contractile regulator Troponin C. Importantly, muscle-specific knockdown of BAF led to increased DNA content in myonuclei, phenocopying the LINC mutant phenotype. We propose that mechanical stimuli transmitted via the LINC complex act via BAF to regulate synchronized cell-cycle progression of myonuclei across single myofibers.


Figures

Figure 1.
Figure 1.
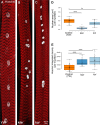
LINC mutant myonuclei are smaller and contain increased DNA content. Representative projected confocal images of muscle 7 from third-instar larvae of control (A; yw), klar (B), or koi (C) null mutants, labeled with Phalloidin (red) and Hoechst (white). Bar, 10 µm. (D) Quantitative analysis of the nuclear area of control, klar or koi myonuclei. Each dot represents the mean nuclear area value of all myonuclei in an individual myofiber. The myonuclear area of klar and koi are both significantly smaller than control (unpaired t test: ****, P = 10−10; **, P = 0.0039). (E) Quantitative analysis of Hoechst integrated density of control, klar, and koi myonuclei. Each data point represents the mean Hoechst integrated density value of all myonuclei of an individual myofiber 7. klar and koi myonuclei contain more DNA than control (unpaired t test: ****, P ≤ 10−6). Whiskers in D and E extend to data points less than 1.5 interquartile ranges from the first and third quartiles. Images were taken from six distinct larvae (control, n = 23; klar, n = 18; koi, n = 22).
Figure 2.
Figure 2.
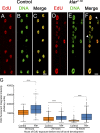
Impaired synchronization of DNA replication and dysregulated cell-cycle progression in klar mutant myonuclei. (A–F) Representative images of EdU incorporation (after EdU feeding for 48 h from early-second to the late-third instar larval stages) in WT (control) (A–C) or klar mutant muscle 6 (D–F) indicated by EdU labeling (red) and DAPI (green) labeling. All nuclei in a specific WT muscle fiber are approximately equally labeled, whereas in klar mutant myonuclei EdU labeling is variable (white arrowheads in F show an EdU-negative nucleus). Bars, 10 µm. (G) Quantification of EdU integrated density of EdU (fluorescence signal) in control (orange) and klar mutant (blue) myonuclei in muscle 7 after EdU feeding of 90, 24, or 12 h of larval development in staged larvae. Each data point represents a single nucleus. klar mutant myonuclei incorporated more EdU in all incubation periods (unpaired t test: ****, P ≤ 6 × 10⁻⁷). For 90 h: control, n = 158 and klar, n = 174 myonuclei; for 24 h: control, n = 377 and klar, n = 760; for 12 h: control, n = 568 and klar, n = 760; for all samples four muscles from six distinct larvae were analyzed. Whiskers extend to data points less than 1.5 interquartile ranges from the first and third quartiles.
Figure 3.
Figure 3.
Impaired synchronization of E2F1 degradation in klar mutant myonuclei. Representative confocal projection images of control (A–C) or klar mutant (D and E) muscle 7 in third-instar larvae, expressing GFP fused to E2F1 degron sequences (GFP::E2F11–203), and labeled with anti-GFP (A and D, green) and Hoechst (B and E, white). (C and F) Corresponding merged images. Bars, 10 µm. Arrows indicate negative GFP-labeled myonuclei in klar mutant. (G) Quantitative analysis of the ratio between GFP mean fluorescent intensity and nuclear area of muscle 7, indicating higher GFP intensity in klar mutant versus control myonuclei (t test: **, P = 0.0085). (H) Quantification of the variation in myonuclear GFP intensity per individual myofiber 7, in control and klar mutant myonuclei (control, n = 42; klar, n = 28). The graph presents the coefficient of variation (standard deviation divided by the mean GFP intensity in myonuclei of an individual myofiber) in klar versus control, indicating higher variability of GFP intensity in klar mutant myonuclei (t test: ****, P = 8.95 × 10⁻⁸). Whiskers in G and H extend to data points less than 1.5 interquartile ranges from the first and third quartiles.
Figure 4.
Figure 4.
Myonuclear DNA content does not change in myofibers with disrupted microtubules. Representative single confocal stacks of third-instar larvae muscle 7 in control (A–C) or after muscle-specific, temporal expression of the MT-severing protein Spastin induced for 2 d during second to third-instar larval growth stages (D–F). Muscles were labeled with anti–α-Tubulin (green; A, C, D, and F), Hoechst (blue), and Phalloidin (red; B, C, E, and F). C and F are merged images. Bar, 10 µm. Note the deletion of α-Tubulin labeling in the Spastin-expressing muscles and its normal expression in the trachea (Tr., arrow; D). Ortho view shown in C′ and F′ corresponds to the white lines in C and in F. (G) Quantitative analysis of the mean myonuclear area in control (Mef2-GAL4;TubGAL80/yw) versus MT-depleted muscle 7 during second- to third-instar stage (Mef-GAL4;TubGAL80>UAS-Spastin) indicates higher nuclear area in the latter group (t test: ****, P = 6 × 10⁻¹²). (H) Quantitative analysis of the mean myonuclear Hoechst integrated density in control (Mef2-GAL4;TubGAL80/yw) versus MT-deleted muscle 7 during second- to third-instar stage (Mef-GAL4;TubGAL80>UAS-Spastin) indicates no significant difference between the two groups (t test: P = 0.13). Images were taken from five different larvae (control, n = 17; Spastin RNAi. n = 18). Whiskers in G and H extend to data points less than 1.5 interquartile ranges from the first and third quartiles.
Figure 5.
Figure 5.
Muscle-specific knockdown of β-PS-integrin promotes increased DNA content in myonuclei. Representative images of control (A and A′, Mef2-GAL4/yw) or β-PS-integrin knockdown (B and B′) muscle 7 labeled with phalloidin (red) and Hoechst (green). A′ and B′ are distinct focal planes at the level of muscle–muscle junction displaying similar magnification. Arrowheads demonstrate the adhesion defect induced by knockdown of β-PS-integrin (compare arrowheads in B′ to A′). Bars, 10 µm. (C) Quantification of the Hoechst integrated density of myonuclei per myofibers in muscle 7 indicates a significant increase in DNA content in β-PS-integrin knockdown versus control (t test: ****, P = 2.5 × 10⁻⁶). Images were taken from five distinct larvae (control, n = 14; integrin RNAi, n = 14). Whiskers extend to data points less than 1.5 interquartile ranges from the first and third quartiles.
Figure 6.
Figure 6.
Profiling of Dam-RNA-Pol II genome occupancy in WT and klar mutant muscles. (A) Flow chart of the experimental procedures for the muscle-specific Dam-Pol II profiling. (B) Normalization of the high-throughput data by using a regression analysis between WT and the klar mutant. Gray dots in the plot represent single genes identified in the muscle-specific targeted Dam-Pol II occupancy. By setting the cut-off criteria false discovery rate (FDR) <0.05 and z-score >1.96 and focusing on more than one Dam-methylation site, the positive hits are highlighted by a black circle. The gene with highest z-score RpLP2 as well as klar are separately labeled. Principal component analysis was performed on a matrix composed of the x and y axis as features of the points. The axis was rotated to the principle components and derives the line that passes through the main axis of variation. This line puts equal weights to the x and y axes, but it is not restricted to pass through the origin. (C) GO analysis of the Dam-RNA-Pol II hits. (D) Two examples of the binding profiles of Dam-Pol II to baf and RpLP2 genes.
Figure 7.
Figure 7.
Tpn C is down-regulated in klar mutant muscles. (A–B′) Representative single confocal stacks of WT (A and A′) and klar mutant (B and B′) muscle 7 labeled with anti–Tpn C (red), Dapi (blue), and MHC (green). A significant reduction in the protein levels of Tpn C is demonstrated, whereas MHC does not change. (C) Quantification of the mean fluorescent intensity of Tpn C in WT and klar mutant muscles is demonstrated. Bars, 10 µm. For control and klar statistics, n = 15 muscles taken from four distinct larvae; ***, P < 0.05. Whiskers extend to data points less than 1.5 interquartile ranges from the first and third quartile ranges.
Figure 8.
Figure 8.
Muscle-specific knockdown of BAF promotes increased DNA content in myonuclei. Representative image of muscle 7 of control (Mef2-GAL4/yw, A–C) or after muscle-specific knockdown of BAF (Mef2-GAL4>BAF RNAi, D–F), labeled with phalloidin (red, A and D), lamin C (green, A and D; white, B and E) and Hoechst (blue, A and D; white, C and F). (G) Quantification of Hoechst integrated density (averaged per myofiber) in the two groups indicates a significant increase of Hoechst integrated density after knockdown of BAF (***, P = 0.0001; control, n = 13; BAF RNAi, n = 15). (H) Quantification of lamin C integrated density (averaged per myofiber) in the two groups indicates a significant increase of lamin C fluorescence after knockdown of BAF (****, P = 7.4 × 10⁻⁶; control, n = 13; BAF RNAi, n = 15). Whiskers extend to data points less than 1.5 interquartile ranges from the first and third quartiles. Bar, 10 µm.

Similar articles

Cited by

References

    1. Amendola M., and van Steensel B.. 2014. Mechanisms and dynamics of nuclear lamina-genome interactions. Curr. Opin. Cell Biol. 28:61–68. 10.1016/j.ceb.2014.03.003 - DOI - PubMed
    1. Arsenovic P.T., Ramachandran I., Bathula K., Zhu R., Narang J.D., Noll N.A., Lemmon C.A., Gundersen G.G., and Conway D.E.. 2016. Nesprin-2G, a component of the nuclear LINC complex, is subject to myosin-dependent tension. Biophys. J. 110:34–43. 10.1016/j.bpj.2015.11.014 - DOI - PMC - PubMed
    1. Attali R., Warwar N., Israel A., Gurt I., McNally E., Puckelwartz M., Glick B., Nevo Y., Ben-Neriah Z., and Melki J.. 2009. Mutation of SYNE-1, encoding an essential component of the nuclear lamina, is responsible for autosomal recessive arthrogryposis. Hum. Mol. Genet. 18:3462–3469. 10.1093/hmg/ddp290 - DOI - PubMed
    1. Balasubramanian L., Lo C.M., Sham J.S., and Yip K.P.. 2013. Remanent cell traction force in renal vascular smooth muscle cells induced by integrin-mediated mechanotransduction. Am. J. Physiol. Cell Physiol. 304:C382–C391. 10.1152/ajpcell.00234.2012 - DOI - PMC - PubMed
    1. Barton L.J., Soshnev A.A., and Geyer P.K.. 2015. Networking in the nucleus: a spotlight on LEM-domain proteins. Curr. Opin. Cell Biol. 34:1–8. 10.1016/j.ceb.2015.03.005 - DOI - PMC - PubMed

Publication types

MeSH terms

LinkOut - more resources