

Simultaneous lineage tracing and cell-type identification using CRISPR-Cas9-induced genetic scars
- PMID: 29644996
- PMCID: PMC5942543
- DOI: 10.1038/nbt.4124
Simultaneous lineage tracing and cell-type identification using CRISPR-Cas9-induced genetic scars
Abstract
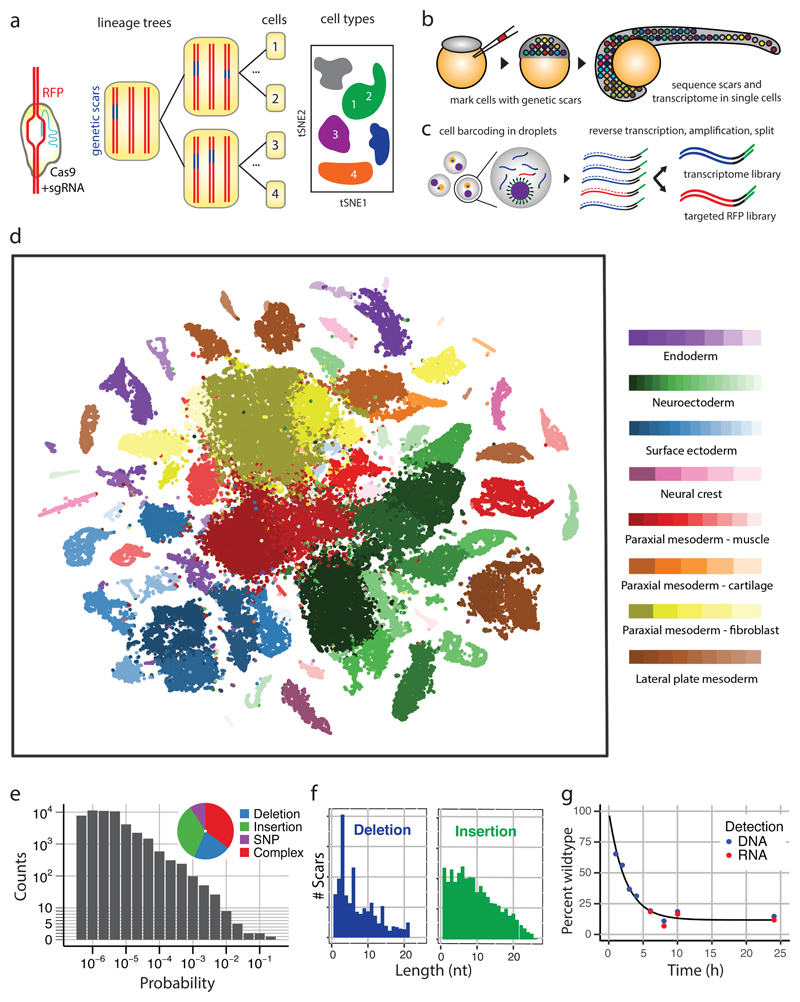
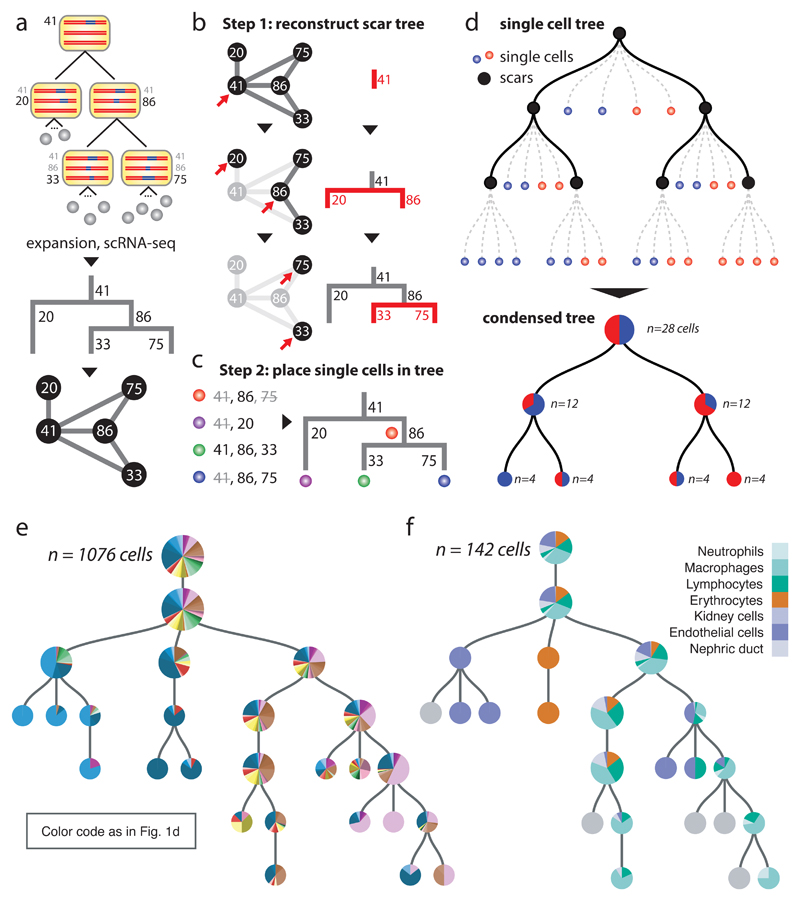
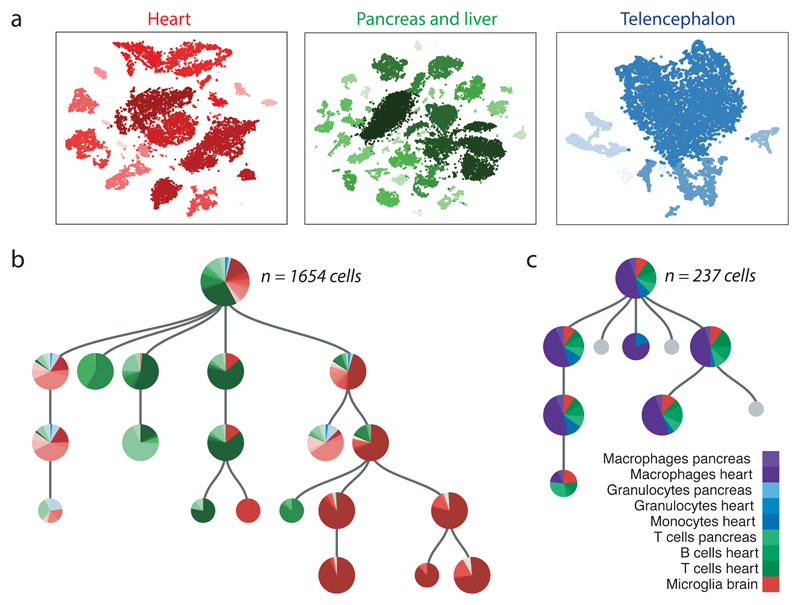
A key goal of developmental biology is to understand how a single cell is transformed into a full-grown organism comprising many different cell types. Single-cell RNA-sequencing (scRNA-seq) is commonly used to identify cell types in a tissue or organ. However, organizing the resulting taxonomy of cell types into lineage trees to understand the developmental origin of cells remains challenging. Here we present LINNAEUS (lineage tracing by nuclease-activated editing of ubiquitous sequences)-a strategy for simultaneous lineage tracing and transcriptome profiling in thousands of single cells. By combining scRNA-seq with computational analysis of lineage barcodes, generated by genome editing of transgenic reporter genes, we reconstruct developmental lineage trees in zebrafish larvae, and in heart, liver, pancreas, and telencephalon of adult fish. LINNAEUS provides a systematic approach for tracing the origin of novel cell types, or known cell types under different conditions.
Conflict of interest statement
The authors declare no competing financial interests.
Figures
Comment in
-
Tracing cell-lineage histories.Nat Rev Genet. 2018 Jun;19(6):327. doi: 10.1038/s41576-018-0015-0. Nat Rev Genet. 2018. PMID: 29713013 No abstract available.
Similar articles
-
LINNAEUS: Simultaneous Single-Cell Lineage Tracing and Cell Type Identification.Methods Mol Biol. 2025;2886:243-263. doi: 10.1007/978-1-0716-4310-5_12. Methods Mol Biol. 2025. PMID: 39745644
-
Large-scale reconstruction of cell lineages using single-cell readout of transcriptomes and CRISPR-Cas9 barcodes by scGESTALT.Nat Protoc. 2018 Nov;13(11):2685-2713. doi: 10.1038/s41596-018-0058-x. Nat Protoc. 2018. PMID: 30353175 Free PMC article.
-
Defining endogenous barcoding sites for CRISPR/Cas9-based cell lineage tracing in zebrafish.J Genet Genomics. 2020 Feb 20;47(2):85-91. doi: 10.1016/j.jgg.2019.11.012. Epub 2020 Feb 7. J Genet Genomics. 2020. PMID: 32173285
-
A New Generation of Lineage Tracing Dynamically Records Cell Fate Choices.Int J Mol Sci. 2022 Apr 30;23(9):5021. doi: 10.3390/ijms23095021. Int J Mol Sci. 2022. PMID: 35563412 Free PMC article. Review.
-
Deciphering neural heterogeneity through cell lineage tracing.Cell Mol Life Sci. 2021 Mar;78(5):1971-1982. doi: 10.1007/s00018-020-03689-3. Epub 2020 Nov 5. Cell Mol Life Sci. 2021. PMID: 33151389 Free PMC article. Review.
Cited by
-
ConvexML: Scalable and accurate inference of single-cell chronograms from CRISPR/Cas9 lineage tracing data.bioRxiv [Preprint]. 2023 Dec 3:2023.12.03.569785. doi: 10.1101/2023.12.03.569785. bioRxiv. 2023. PMID: 38076815 Free PMC article. Preprint.
-
Mammary gland development from a single cell 'omics view.Semin Cell Dev Biol. 2021 Jun;114:171-185. doi: 10.1016/j.semcdb.2021.03.013. Epub 2021 Mar 31. Semin Cell Dev Biol. 2021. PMID: 33810979 Free PMC article. Review.
-
Geostatistical Modeling and Heterogeneity Analysis of Tumor Molecular Landscape.Cancers (Basel). 2022 Oct 25;14(21):5235. doi: 10.3390/cancers14215235. Cancers (Basel). 2022. PMID: 36358654 Free PMC article.
-
LinRace: cell division history reconstruction of single cells using paired lineage barcode and gene expression data.Nat Commun. 2023 Dec 16;14(1):8388. doi: 10.1038/s41467-023-44173-3. Nat Commun. 2023. PMID: 38104156 Free PMC article.
-
Single-cell multi-omics and lineage tracing to dissect cell fate decision-making.Stem Cell Reports. 2023 Jan 10;18(1):13-25. doi: 10.1016/j.stemcr.2022.12.003. Stem Cell Reports. 2023. PMID: 36630900 Free PMC article. Review.
References
Publication types
MeSH terms
Grants and funding
LinkOut - more resources
Full Text Sources
Other Literature Sources
Molecular Biology Databases
