. 2018 Apr 11;9(1):1387.
doi: 10.1038/s41467-018-03748-1.

Srf destabilizes cellular identity by suppressing cell-type-specific gene expression programs

Affiliations

Srf destabilizes cellular identity by suppressing cell-type-specific gene expression programs

Takashi Ikeda et al. Nat Commun. .

Abstract

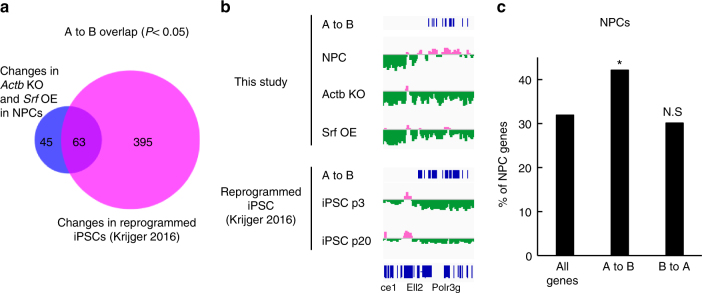
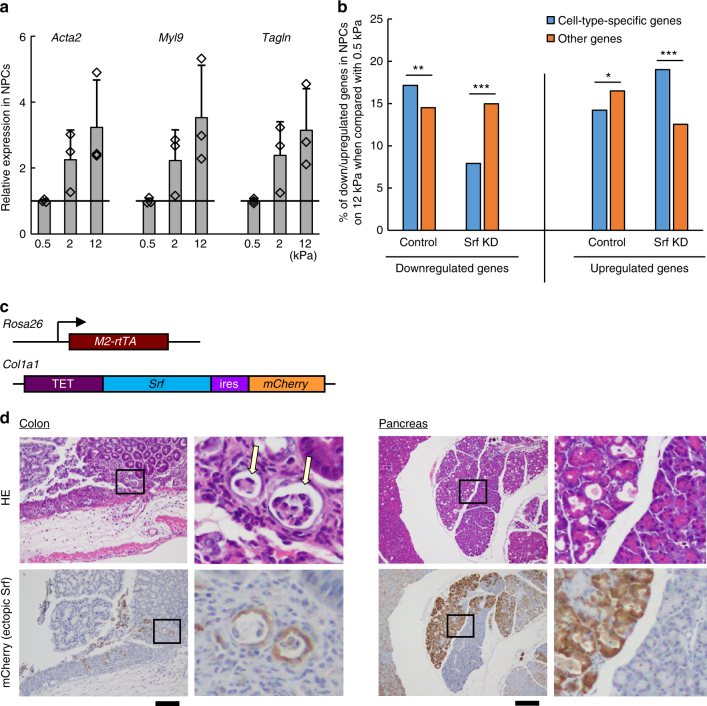
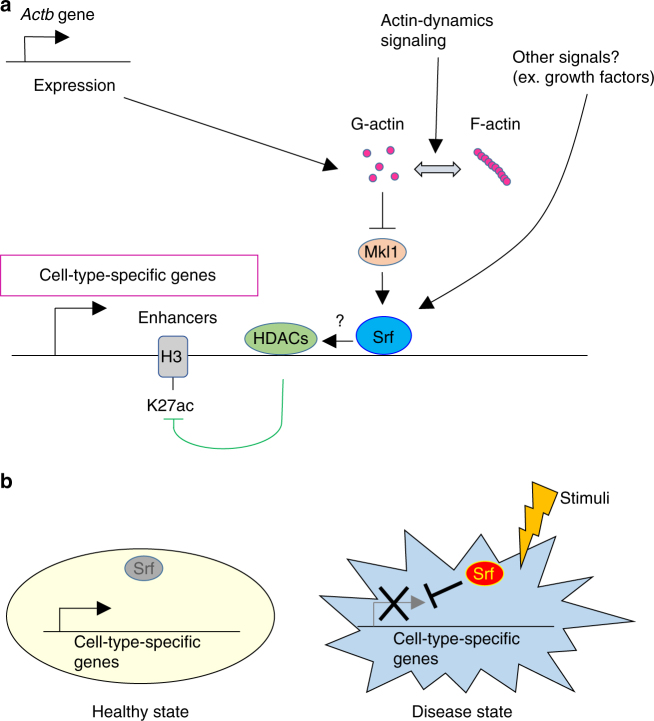
Multicellular organisms consist of multiple cell types. The identity of these cells is primarily maintained by cell-type-specific gene expression programs; however, mechanisms that suppress these programs are poorly defined. Here we show that serum response factor (Srf), a transcription factor that is activated by various extracellular stimuli, can repress cell-type-specific genes and promote cellular reprogramming to pluripotency. Manipulations that decrease β-actin monomer quantity result in the nuclear accumulation of Mkl1 and the activation of Srf, which downregulate cell-type-specific genes and alter the epigenetics of regulatory regions and chromatin organization. Mice overexpressing Srf exhibit various pathologies including an ulcerative colitis-like symptom and a metaplasia-like phenotype in the pancreas. Our results demonstrate an unexpected function of Srf via a mechanism by which extracellular stimuli actively destabilize cell identity and suggest Srf involvement in a wide range of diseases.


Conflict of interest statement

The authors declare no competing interests.

Figures

Fig. 1
Fig. 1
Cell-type-specific genes inhibit reprogramming. a Outline of the screening strategy used to identify factors that inhibit reprogramming. b Cell-type-specific genes are enriched by the screenings. Genes enriched in the second screening of NPCs and the high positive fraction in the screening of hepatoblasts were subjected to tissue expression analysis with DAVID, . Fisher’s exact test. c Factors that inhibit reprogramming are different among cell types. Identified genes from the second screening of NPCs, the high positive fraction in the screening of hepatoblasts and Yang et al. were used to generate the Venn diagram. Numbers indicate the number of genes
Fig. 2
Fig. 2
β-Actin inhibits reprogramming and Srf activity. a Knockdown of Actb gene expression enhances reprogramming. Reprogramming efficiencies from NPCs are shown as iPSC colony numbers relative to shLuc + mock-introduced cells. Means ± SD are shown (n = 3). Dots indicate individual data points. Student’s t-test (*P < 0.05). b Knockdown of Actb alters various gene expressions. A scatter plot comparing gene expressions of Actb-knockdown NPCs and control cells. Blue dots and magenta dots show genes upregulated and downregulated > 2-fold, respectively. Some known Srf target gene symbols are indicated. c Srf-binding consensus motifs are enriched upstream of genes upregulated by Actb knockdown. Genes upregulated > 2-fold in NPCs were subjected to a motif search using Transfac to search protein-binding consensus sequences that were enriched in upstream regions. d Srf is activated by Actb knockdown. Expression levels relative to control cells for each Srf target gene in NPCs are shown (n = 2, technical duplicate). Values are means ± SD of the microarray data. Dots indicate individual data points
Fig. 3
Fig. 3
Srf and its cofactor, Mkl1, promote reprogramming. a Srf promotes reprogramming. Values are means ± SD of the numbers of iPSC colonies produced relative to control cells (n = 3). OE indicates overexpression. Dots indicate individual data points. Student’s t-test (***P < 0.0005, **P < 0.005, *P < 0.05). b Mkl1 mainly localizes in the nucleus upon β-actin depletion. Immunofluorescence microscopy of NPCs using anti-Mkl1 antibody and images of the corresponding bright field and DAPI staining. Bar, 20 µm. c Mkl1 promotes reprogramming. Values are means ± SD of numbers of iPSC colonies generated from NPCs relative to the control (n = 3). Dots indicate individual data points. Student’s t-test (***P < 0.0005). d Srf promotes reprogramming at early phase. NPCs were infected with egfp-expressing lentivirus or Srf-overexpressing lentivirus at the days indicated (d1 is the day of reprogramming initiation by Dox addition). Vertical axis shows the reprogramming efficiency of Srf-overexpressing cells to egfp-expressing cells in logarithmic (log) scale (n = 3). Dots indicate individual data points. Asterisks indicate statistically significant differences between Srf overexpression and control on the day of virus infection (Student’s t-test; *P < 0.05)
Fig. 4
Fig. 4
Srf preferentially downregulates cell-type-specific genes. a A scatter plot showing gene expressions that are > 2-fold different between Srf-overexpressing NPCs and control cells. Blue dots show NPC genes, which are defined as genes whose expression levels in NPCs are > 2-fold compared with those in ESCs. b Cell-type-specific genes are enriched in genes downregulated by Srf overexpression. Asterisks indicate a significant difference between genes in the indicated group and all other genes (two-sided Fisher’s exact test; ***P < 0.0005). c Srf preferentially binds to open and H3K27ac-marked genomic regions. The peak number in the overlapped area is based on the number of Srf-binding peaks. Overlaps were analyzed by the hypergeometric test. d Srf removes adjacent H3K27ac in NPCs. Means of ChIP-seq signals around genomic regions to which Srf was bound within 2000 bp from TSS (left panels) and other regions (right panel). e Matrices of consensus binding motifs of HDACs and Ep300 are enriched near Srf-binding sites. Motif analyses of ChIP-seq data of Srf in NPCs indicated that matrices of the motifs of HDAC1, HDAC2, and Ep300 were enriched within 25 bp of the Srf-binding sites in NPCs. Fisher’s exact test
Fig. 5
Fig. 5
β-Actin-Srf pathway induces a global reorganization of the subnuclear compartment. a Activation of the β-actin-Srf pathway alone induces a global reorganization of the subnuclear compartment that resembles partial reprogramming. Venn diagram of the chromatin-organization changes from compartment A to compartment B in NPCs. Peak numbers are shown. b A region on chromosome 13 where the patterns from A to B are similar in Actb knockout, Srf overexpression in NPCs, and reprogramming to iPSCs. c Cell-type-specific genes are enriched in genes that change their subnuclear compartment from A to B by the β-actin-Srf pathway. Asterisks and N.S. indicate a significant difference and no significant difference, respectively, between genes in the indicated group and all other genes (two-sided Fisher’s exact test; *P < 0.05)
Fig. 6
Fig. 6
Srf misactivation causes various diseases. a Srf activity is regulated by an exogenous cue, extracellular matrix stiffness. The expressions of Srf target genes in NPCs cultured on matrices of various stiffness relative to the value of each gene on the softest matrix (0.5 kPa). Values are means ± SD of the relative expression levels normalized to Gapdh expression (n = 3). Dots indicate individual data points. b Cell-type-specific genes are downregulated by Srf with stiffness. Percentages of genes differentially regulated in NPCs among cell-type-specific genes and other genes between 0.5 and 12 kPa matrices. Two-sided Fisher’s exact test (***P < 0.0005, **P < 0.005, *P < 0.05). c Structure of transgenes in KH2-Srf mice. d Srf misactivation causes diseases. Immunohistological observations of chimeric mice that were treated with Dox for 7 days. Upper images are representative images of hematoxylin/eosin staining (HE) and lower images are roughly corresponding view fields of immunohistochemistry sections for Srf ectopic expression (mCherry) in colon and pancreas in a chimeric mouse overexpressing Srf. Right panels of each tissue are magnified views of the areas indicated by the squares in the respective left panels. Arrows indicate sites exhibiting crypt abscess. Bars, 200 µm
Fig. 7
Fig. 7
A schematic model indicating that Srf destabilizes cell identity by repressing cell-type-specific genes. a A model of Srf-related pathways to repress cell-type-specific gene expressions. Srf preferentially binds to open regions which preferentially contain cell-type-specific genes. Various signals, such as Actb expression changes and β-actin polymerization dynamics, are transduced to Srf. Srf activated by Mkl1 inactivates the surrounding regions, possibly by recruiting or activating HDACs. Other signals that regulate Srf through β-actin-independent pathways could also participate in this regulation. b A schematic view of a possible mechanism by which misactivation of Srf causes diseases. When the activity of Srf is at physiological levels, cell-type-specific genes are normally expressed. On the other hand, when Srf is activated at non-physiological levels (misactivation), these genes are repressed, triggering malfunction of the cells and tissues and sometimes leading to disease

Similar articles

Cited by

References

    1. Feinberg AP, Koldobskiy MA, Gondor A. Epigenetic modulators, modifiers and mediators in cancer aetiology and progression. Nat. Rev. Genet. 2016;17:284–299. doi: 10.1038/nrg.2016.13. - DOI - PMC - PubMed
    1. Sen P, Shah PP, Nativio R, Berger SL. Epigenetic mechanisms of longevity and aging. Cell. 2016;166:822–839. doi: 10.1016/j.cell.2016.07.050. - DOI - PMC - PubMed
    1. Lane SW, Williams DA, Watt FM. Modulating the stem cell niche for tissue regeneration. Nat. Biotechnol. 2014;32:795–803. doi: 10.1038/nbt.2978. - DOI - PMC - PubMed
    1. Heinz S, Romanoski CE, Benner C, Glass CK. The selection and function of cell type-specific enhancers. Nat. Rev. Mol. Cell Biol. 2015;16:144–154. doi: 10.1038/nrm3949. - DOI - PMC - PubMed
    1. Whyte WA, et al. Master transcription factors and mediator establish super-enhancers at key cell identity genes. Cell. 2013;153:307–319. doi: 10.1016/j.cell.2013.03.035. - DOI - PMC - PubMed

Publication types

MeSH terms