. 2018 Apr 9;45(1):83-100.e7.
doi: 10.1016/j.devcel.2018.03.010.

The HCMV Assembly Compartment Is a Dynamic Golgi-Derived MTOC that Controls Nuclear Rotation and Virus Spread

Affiliations

The HCMV Assembly Compartment Is a Dynamic Golgi-Derived MTOC that Controls Nuclear Rotation and Virus Spread

Dean J Procter et al. Dev Cell. .

Abstract

Human cytomegalovirus (HCMV), a leading cause of congenital birth defects, forms an unusual cytoplasmic virion maturation site termed the "assembly compartment" (AC). Here, we show that the AC also acts as a microtubule-organizing center (MTOC) wherein centrosome activity is suppressed and Golgi-based microtubule (MT) nucleation is enhanced. This involved viral manipulation of discrete functions of MT plus-end-binding (EB) proteins. In particular, EB3, but not EB1 or EB2, was recruited to the AC and was required to nucleate MTs that were rapidly acetylated. EB3-regulated acetylated MTs were necessary for nuclear rotation prior to cell migration, maintenance of AC structure, and optimal virus replication. Independently, a myristoylated peptide that blocked EB3-mediated enrichment of MT regulatory proteins at Golgi regions of the AC also suppressed acetylated MT formation, nuclear rotation, and infection. Thus, HCMV offers new insights into the regulation and functions of Golgi-derived MTs and the therapeutic potential of targeting EB3.

Keywords: Golgi; acetylation; cell migration; cytomegalovirus; end-binding protein; microtubule organizing center; nuclear rotation; virus infection.


Conflict of interest statement

Declaration of Interests

Y.K. and D.W. filed an invention disclosure on the use of HEBTRON as an antiviral. The authors declare no competing financial interests.

Figures
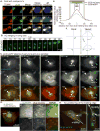
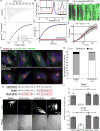
Figure 1
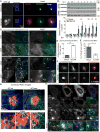
Figure 1. AC dynamics and nuclear rotation during HCMV infection
(A) NHDFs were infected with TB40/E-UL99-eGFP at MOI 0.5 for 4d. Fixed cells were stained for GFP, TGN46 and gB. Nuclei were stained with Hoechst. Note, both Golgi structures in each cell stain for UL99-eGFP and gB, and appear to have weak connections. (B) Time lapse images (Movie S1A) of NHDFs infected with TB40E-UL99-eGFP at MOI 0.5 imaged 3–5d.p.i. illustrating AC merging. (C) Time lapse images (Movie S1B) of NHDFs co-infected with TB40/E-UL99-eGFP and TB40/E-UL32-mCherry at MOI 0.5 imaged 3–5d.p.i. UL99 labels the AC. UL32 domains form in the nucleus (ND) prior to the appearance of virus particles in the AC (acVPs) and then in the cytoplasm (cVP). (D) Still (Movie S1B) showing virus particles in the AC and cytoplasm (cyto) co-labeled with UL99-eGFP and UL32-mCherry. (E) Distribution of fluorescent intensity for UL32-mCherry and UL99-eGFP particles in D. measured using line-scan analysis. n = 5 (64 particles). Both peaks are in the size range of HCMV particles (indicated), and drop rapidly outside this size-range. (F) NHDFs expressing NLS-mCherry mock infected or infected with TB40E-UL99-eGFP at MOI 0.5 and imaged 3–5d.p.i. Displacement of NLS-mCherry-labeled nuclei (Movie S2) was measured. 2 representative examples per group are shown. (G) Time lapse images (Movie S3) of NHDFs co-infected with TB40/E-UL99-eGFP and TB40/E-UL32-mCherry at MOI 0.5. Arrows indicate the direction of cell migration. nuc=nucleus. See also Figure S1, Movies S1–S3.
Figure 2
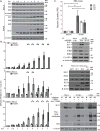
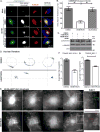
Figure 2. The HCMV AC is a Golgi-derived MTOC
(A–B) NHDFs were mock infected or infected with TB40/E at MOI 3. (A) Cells were fixed 5.d.p.i. and stained for γ-tubulin, pericentrin and gB. Nuclei were stained with Hoechst. (B) Cell lysates were prepared at the indicated times and analyzed by WB. Lower: Densitometry analysis of γ-tubulin relative to α-tubulin. n = 3; unpaired two-tailed t-test, *p<0.05. (C–F) NHDFs were mock-infected or infected with AD169 at MOI 3 for 3d. Cells were treated with 10µM nocodazole for 8h before washout for the indicated time. (C) Samples were stained for tyrosinated tubulin, TGN46 and pericentrin. Red arrows indicate centrosomes, white arrows indicate Golgi fragments. Insets show non-centrosomal nucleation sites. (D) The number of new MTs at non-centrosomal sites 10 min post-washout was quantified. n = 3 (>65 cells), bars = s.e.m., unpaired two-tailed t-test, ****p = 0.0001. (E–F) Tyrosinated MTs at centrosomes 10 min post-nocodazole washout imaged using confocal microscopy. (E) Area occupied by tyrosinated MTs nucleated at centrosomes was measured. n = 3 (>45 cells), bars = s.e.m., unpaired two-tailed t-test, *p = 0.0240. (F) Representative examples of MTs at centrosomes, including a bright γ-tubulin merge used to identify centrosomes. (G) NHDFs were infected with TB40/E at MOI 1 for 5d. Fixed cells were stained for acetylated tubulin and TGN46, along with hoechst. Samples were imaged using confocal microscopy. Top and bottom Z-plane images of the AC are shown. Insets show acetylated MTs localized at TGN sites. (H) NHDFs were infected and treated with nocodazole as in C. Samples were stained for acetylated and tyrosinated (tyr) tubulin, along with TGN46. Red arrows indicate centrosomes, white arrows in insets indicate Golgi fragments. See also Figure S1, Movie S4.
Figure 3
Figure 3. HCMV increases EB protein levels
(A) Growth-arrested NHDFs were mock-infected or infected with TB40/E at MOI 3 for the indicated times. Cell lysates were analyzed by WB. (B) Densitometry analysis of EB1, EB2 and EB3 relative to α-tubulin. n = 3; bars = s.e.m.;, *p<0.05, unpaired two-tailed t-test (C) Growth-arrested NHDFs were mock-infected or infected at MOI 3 for 4d. EB transcript levels were measured using qRT-PCR. EB levels were normalized to uninfected controls (arbitrarily set to 1). n = 3; bars = s.e.m; *p<0.05, ***p<0.001, unpaired two-tailed t-test. (D) NHDFs were treated with control or IE1/2 siRNA prior to infection with AD169 at MOI 3 for 3d. Cell lysates were analyzed by WB for the indicated proteins. (E) NHDFs were transduced with retroviruses encoding GFP or IE proteins. Samples were analyzed by WB. (F) NHDFs were infected with AD169 at MOI 3 in the presence of DMSO or CDK1 inhibitor (JNJ-770662), re-dosing daily, for the indicated times. Samples were analyzed by WB. See also Figure S2.
Figure 4
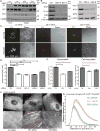
Figure 4. EB1 and EB3 play distinct roles in HCMV replication
(A) NHDFs were treated with siRNA 30h prior to infection (+) or with a second siRNA treatment at 3d.p.i. (++). Cultures were infected at MOI 3 for 5d. Lysates were analyzed by WB for the indicated proteins. Note, IE1/2 are expressed because early infection is not affected using this siRNA treatment strategy. (B–D) NHDFs were treated with siRNAs as in A. and infected with TB40/E-eGFP at MOI 0.001 for 14d. (B) Cells were lysed and analyzed by WB for the indicated proteins. Note, IE1/2 are reduced because of reduced HCMV spread in EB1 or EB3 depleted cultures. (C) Phase and fluorescent images of plaques for TB40/E or AD169. (D) Plaque sizes in C for TB40/E were measured. n = 3 (>22 plaques); bars = s.e.m. ***p=0.0005, unpaired two-tailed t-test. (E) NHDFs were infected with TB40/E at MOI 3. Cell supernatants and cell-associated virus were harvested at 7d.p.i. and titrated on NHDFs. n = 3; bars = s.e.m; *p<0.05, **p<0.01, unpaired two-tailed t-test. (F) Still images (Movie S5A) of NHDFs expressing eGFP-CLIP170, treated with siRNAs as in A and infected with TB40/E-UL32-mCherry at MOI 1 for 5d. Red boxes highlight elongated eGFPCLIP170 tracks in EB1-depleted cells. (G) Line-scan analysis of eGFP-CLIP170 intensity distribution from the microtubule plus-end in F. n = 10 (>150 MT linescans); bars = s.e.m. See also Movie S5A.
Figure 5
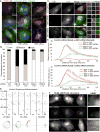
Figure 5. EB3 regulates acetylated MTs, nuclear rotation and AC structure
(A–D) NHDFs were treated with siRNAs and infected with TB40/E at MOI 1 for 5d. (A) Fixed samples were stained for acetylated tubulin and TGN46. Nuclei were stained with Hoechst. (B) Percentage of cells containing low (as in EB3 siRNA panels in A.), medium (as in Ctrl siRNA panels) or high (as in EB1 siRNA panels) levels of acetylated MTs. n = as indicated. (C) Fixed samples were stained for EB1, EB3 and TGN46. Enlarged insets show EB1 and EB3 comets. (D) Line-scan analysis of EB1 or EB3 comet intensity and distribution in samples in C. Note, loss of one EB increases MT tip binding by the other. Top: Distributions of EB1 (red) or EB3 (green) in control siRNA (solid) or EB1 siRNA (dashed) samples. Bottom: Distributions of EB1 (red) or EB3 (green) in control siRNA (solid) or EB3 siRNA (dashed) samples. n = 5 (>125 MT linescans); bars = s.e.m. (E–F) NHDFs were treated with siRNAs and infected with TB40/E-UL99-eGFP at MOI 0.5. (E) Effects on nuclear rotation: Cells were imaged at 2 frames per hour between 3–5d.p.i. Time lapse images (Movie S5B) were used to measure nuclear rotation. Bottom: Examples of rotations including changes in direction (red and orange). (F) Effects on AC structure: Still images (Movie S6) from faster frame rate analysis of UL99-eGFP showing different AC architectures in control versus EB1 or EB3-depleted cells. Insets use non-linear scaling to show details within the bright AC region, and highlight cytoplasmic virions and MVBs. See also Movies S5B–S6.
Figure 6
Figure 6. Characterization of HEBTRON
(A) ITC of HEBTRON binding to purified EB3 C-terminus (200–281aa). KD, binding enthalpy, and stoichiometry were calculated from changes in heat upon binding of HEBTRON to the protein using the "one set of sites" binding model. (B) Thermal unfolding of full-length EB3 alone (blue) or with HEBTRON (red) using NanoDSF. The first derivative of the 350/330 nm (peak) defines transitions between folded (left) to unfolded (right) states. Magnified insets show 0.2°C temperature shift (green lines) for the complex. This suggests HEBTRON stabilizes dimers. (C) FRET signal after mixing full-length EB3-CFP and EB3-YFP without (blue) or with HEBTRON (red). FRET indicates formation of YFP/CFP-EB3 dimers, blocked by HEBRTON at 1:1 molar ratio. (D) NHDFs were treated with 10µM Myr-FITC-conjugated HEBTRON. Time lapse images were taken and overlaid with DIC images at the indicated times. (E) % uptake of Myr-FITC-conjugated HEBTRON in NHDFs over time was determined by the normalized fluorescence intensity of the cell. n = 3; assaying 32 cells. Bars = s.e.m. (F) NHDFs treated with DMSO or 25µM HEBTRON were infected with TB40/E at MOI 1 for 5d. Fixed cells were stained for acetylated tubulin and gB. (G) % DMSO or HEBTRON-treated cells in F containing acetylated MTs. n = as indicated. (H) Sequence of HEBTRON, MutN or MutN-MutC. (I) NHDFs treated with DMSO or 25µM HEBTRON, Mut-N or MutN-MutC were infected with TB40/E-eGFP at MOI 0.001 for 12d. Representative phase and fluorescent images of plaques. (J) Cells were treated and infected with TB40/E or AD169 as in I. Plaque areas are shown. n = 3 (>40 and >50 plaques. respectively); bars = s.e.m.; p*<0.05, **p<0.01, ***p<0.001, unpaired two-tailed t-test. See also Figure S3.
Figure 7
Figure 7. HEBTRON blocks recruitment of CDK5RAP2, nuclear rotation, and HCMV replication
(A–B) NHDFs treated with DMSO or 25µM HEBTRON or MutN-MutC were infected at MOI 1 for 5d. (A) Fixed cells were stained for TGN46 and CDK5RAP2. Example of measurements of CDK5RAP2-positive area (based on fluorescence above intensity threshold). (B) Area measurements of CDK5RAP2 at the AC above threshold intensity. n = 3 (>90 cells), bars = s.e.m; **p<0.01, unpaired two-tailed t-test. (C) HEBTRON does not affect CDK5RAP2 or EB3 abundance. NHDFs treated with DMSO or 25µM HEBTRON, MutN or MutN-MutC were infected with AD169 at MOI 3 for 5d. Lysates were analyzed by WB. (D–E) NHDFs treated with DMSO or 25µM HEBTRON were infected with TB40/E-UL99-eGFP at MOI 0.5. (D) Time lapse imaging was performed 3–5d.p.i (Movie S7A) and nuclear displacement was measured. Representative traces are shown. (E) Time lapse imaging of the AC at 5d.p.i. (Movie S7B). Still images show AC structure in DMSO or HEBTRON-treated cells. Insets and non-linear scaling show details within the bright AC. Arrows indicate virus particles and MVBs. (F–G) NHDFs treated with DMSO or 25µM HEBTRON were infected with TB40/E at the indicated MOI. Infectious virus in culture supernatants was titrated. (F) Spreading assay infections at MOI 0.001 for 12d. n = 2; bars = s.e.m. (G) Single cycle infections at MOI 1 for 7d. n = 3; bars = s.e.m. *p<0.05, unpaired two-tailed t-test. See also Figure S3 and S4 and Movie S7.

Comment in

Similar articles

Cited by

References

    1. Akhmanova A, Steinmetz MO. Control of microtubule organization and dynamics: two ends in the limelight. Nat Rev Mol Cell Biol. 2015;16:711–726. - PubMed
    1. Alwine JC. The human cytomegalovirus assembly compartment: a masterpiece of viral manipulation of cellular processes that facilitates assembly and egress. PLoS Pathog. 2012;8:e1002878. - PMC - PubMed
    1. Ban R, Matsuzaki H, Akashi T, Sakashita G, Taniguchi H, Park SY, Tanaka H, Furukawa K, Urano T. Mitotic regulation of the stability of microtubule plus-end tracking protein EB3 by ubiquitin ligase SIAH-1 and Aurora mitotic kinases. J Biol Chem. 2009;284:28367–28381. - PMC - PubMed
    1. Bazellieres E, Massey-Harroche D, Barthelemy-Requin M, Richard F, Arsanto JP, Le Bivic A. Apico-basal elongation requires a drebrin-E-EB3 complex in columnar human epithelial cells. J Cell Sci. 2012;125:919–931. - PubMed
    1. Buchkovich NJ, Maguire TG, Alwine JC. Role of the endoplasmic reticulum chaperone BiP, SUN domain proteins, and dynein in altering nuclear morphology during human cytomegalovirus infection. J Virol. 2010;84:7005–7017. - PMC - PubMed

Publication types

MeSH terms

Substances