Ribosome profiling uncovers selective mRNA translation associated with eIF2 phosphorylation in erythroid progenitors
- PMID: 29634759
- PMCID: PMC5892948
- DOI: 10.1371/journal.pone.0193790
Ribosome profiling uncovers selective mRNA translation associated with eIF2 phosphorylation in erythroid progenitors
Abstract
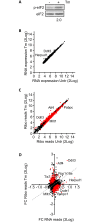
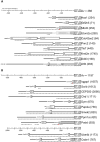
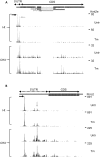
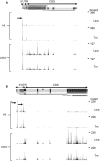
The regulation of translation initiation factor 2 (eIF2) is important for erythroid survival and differentiation. Lack of iron, a critical component of heme and hemoglobin, activates Heme Regulated Inhibitor (HRI). This results in phosphorylation of eIF2 and reduced eIF2 availability, which inhibits protein synthesis. Translation of specific transcripts such as Atf4, however, is enhanced. Upstream open reading frames (uORFs) are key to this regulation. The aim of this study is to investigate how tunicamycin treatment, that induces eIF2 phosphorylation, affects mRNA translation in erythroblasts. Ribosome profiling combined with RNA sequencing was used to determine translation initiation sites and ribosome density on individual transcripts. Treatment of erythroblasts with Tunicamycin (Tm) increased phosphorylation of eIF2 2-fold. At a false discovery rate of 1%, ribosome density was increased for 147 transcripts, among which transcriptional regulators such as Atf4, Tis7/Ifrd1, Pnrc2, Gtf2h, Mbd3, JunB and Kmt2e. Translation of 337 transcripts decreased more than average, among which Dym and Csde1. Ribosome profiling following Harringtonine treatment uncovered novel translation initiation sites and uORFs. Surprisingly, translated uORFs did not predict the sensitivity of transcripts to altered ribosome recruitment in presence or absence of Tm. The regulation of transcription and translation factors in reponse to eIF2 phosphorylation may explain the large overall response to iron deficiency in erythroblasts.
Conflict of interest statement
Figures


Similar articles
-
Translation of 5' leaders is pervasive in genes resistant to eIF2 repression.Elife. 2015 Jan 26;4:e03971. doi: 10.7554/eLife.03971. Elife. 2015. PMID: 25621764 Free PMC article.
-
Phosphorylation of eIF2 directs ATF5 translational control in response to diverse stress conditions.J Biol Chem. 2008 Mar 14;283(11):7064-73. doi: 10.1074/jbc.M708530200. Epub 2008 Jan 14. J Biol Chem. 2008. PMID: 18195013
-
Phosphorylation of eIF2 facilitates ribosomal bypass of an inhibitory upstream ORF to enhance CHOP translation.J Biol Chem. 2011 Apr 1;286(13):10939-49. doi: 10.1074/jbc.M110.216093. Epub 2011 Feb 1. J Biol Chem. 2011. PMID: 21285359 Free PMC article.
-
Upstream Open Reading Frames Differentially Regulate Gene-specific Translation in the Integrated Stress Response.J Biol Chem. 2016 Aug 12;291(33):16927-35. doi: 10.1074/jbc.R116.733899. Epub 2016 Jun 29. J Biol Chem. 2016. PMID: 27358398 Free PMC article. Review.
-
Eukaryotic initiation factor eIF2.Int J Biochem Cell Biol. 1999 Jan;31(1):25-9. doi: 10.1016/s1357-2725(98)00128-9. Int J Biochem Cell Biol. 1999. PMID: 10216940 Review.
Cited by
-
Translational control of stem cell function.Nat Rev Mol Cell Biol. 2021 Oct;22(10):671-690. doi: 10.1038/s41580-021-00386-2. Epub 2021 Jul 16. Nat Rev Mol Cell Biol. 2021. PMID: 34272502 Review.
-
eIF5B drives integrated stress response-dependent translation of PD-L1 in lung cancer.Nat Cancer. 2020 May;1(5):533-545. doi: 10.1038/s43018-020-0056-0. Epub 2020 Apr 20. Nat Cancer. 2020. PMID: 32984844 Free PMC article.
-
Arginine metabolism regulates human erythroid differentiation through hypusination of eIF5A.Blood. 2023 May 18;141(20):2520-2536. doi: 10.1182/blood.2022017584. Blood. 2023. PMID: 36735910 Free PMC article.
-
Iron-loaded deferiprone can support full hemoglobinization of cultured red blood cells.Sci Rep. 2023 Apr 28;13(1):6960. doi: 10.1038/s41598-023-32706-1. Sci Rep. 2023. PMID: 37117329 Free PMC article.
-
Genome-wide association study reveals the underlying regulatory mechanisms of red blood traits in Anadara granosa.BMC Genomics. 2024 Oct 4;25(1):931. doi: 10.1186/s12864-024-10857-3. BMC Genomics. 2024. PMID: 39367301 Free PMC article.
References
-
- Chen J-J. Regulation of protein synthesis by the heme-regulated eIF2alpha kinase: relevance to anemias. Blood. 2007;109: 2693–9. doi: 10.1182/blood-2006-08-041830 - DOI - PMC - PubMed
-
- Kühn LC. Iron regulatory proteins and their role in controlling iron metabolism. Metallomics. 2015;7: 232–243. doi: 10.1039/c4mt00164h - DOI - PubMed
-
- Wek RC, Jiang H-Y, Anthony TG. Coping with stress: eIF2 kinases and translational control. Biochem Soc. 2006;34: 7–11. doi: 10.1042/BST20060007 - DOI - PubMed
-
- Hinnebusch AG. Molecular mechanism of scanning and start codon selection in eukaryotes. Microbiol Mol Biol Rev. 2011;75: 434–67. doi: 10.1128/MMBR.00008-11 - DOI - PMC - PubMed
Publication types
MeSH terms
Substances
Grants and funding
LinkOut - more resources
Full Text Sources
Other Literature Sources

