. 2018 May 7;215(5):1365-1382.
doi: 10.1084/jem.20171417. Epub 2018 Apr 6.

Macrophage/microglial Ezh2 facilitates autoimmune inflammation through inhibition of Socs3

Affiliations

Macrophage/microglial Ezh2 facilitates autoimmune inflammation through inhibition of Socs3

Xingli Zhang et al. J Exp Med. .

Abstract

Histone 3 Lys27 (H3K27) trimethyltransferase Ezh2 is implicated in the pathogenesis of autoimmune inflammation. Nevertheless, the role of Ezh2 in macrophage/microglial activation remains to be defined. In this study, we identified that macrophage/microglial H3K27me3 or Ezh2, rather than functioning as a repressor, mediates toll-like receptor (TLR)-induced proinflammatory gene expression, and therefore Ezh2 depletion diminishes macrophage/microglial activation and attenuates the autoimmune inflammation in dextran sulfate sodium-induced colitis and experimental autoimmune encephalomyelitis. Mechanistic characterizations indicated that Ezh2 deficiency directly stimulates suppressor of cytokine signaling 3 (Socs3) expression and therefore enhances the Lys48-linked ubiquitination and degradation of tumor necrosis factor receptor-associated factor 6. As a consequence, TLR-induced MyD88-dependent nuclear factor κB activation and the expression of proinflammatory genes in macrophages/microglia are compromised in the absence of Ezh2. The functional dependence of Ezh2 for Socs3 is further illustrated by the rescue experiments in which silencing of Socs3 restores macrophage activation and rescues autoimmune inflammation in macrophage/microglial Ezh2-deficient mice. Together, these findings establish Ezh2 as a macrophage lineage-specific mediator of autoimmune inflammation and highlight a previously unknown mechanism of Ezh2 function.


Figures

Figure 1.
Figure 1.
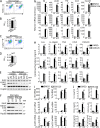
GSK126 suppresses MyD88-dependent proinflammatory responses in macrophages/microglia. (A–D) Flow cytometry of the surface CD11b and F4/80 expression and MTT analysis of primary cultured bone marrow–derived macrophages (A and B) or microglia (C and D) that were pretreated with DMSO or GSK126 (4 µM) for 3 d. (E–G and I) Immunoblot analysis (E and F) of Ezh2, H3K27me3, H3, and Hsp60 (loading control) in whole-cell lysates and real-time qRT-PCR analysis (G and I) of the indicated proinflammatory genes of macrophages (E and G) or microglia (F and I) that were pretreated with DMSO or GSK126 (4 µM) for 3 d and then left nontreated (NT) or stimulated for 6 h with the ligands of different TLRs: TLR4 (LPS, 100 ng/ml), TLR9 (CpG, 2.5 µM), and TLR3 (pI:C, 20 µg/ml). (H and J) ELISA showing the production of indicated proinflammatory cytokines/chemokines in the culture supernatants of macrophages (H) or microglia (J) that were pretreated with DMSO or GSK126 (4 µM) for 3 d and then left nontreated (NT) or treated for 24 h with the indicated TLR ligands. The qRT-PCR data were normalized to a reference gene Actb (β-actin), and other data were shown as mean ± SD based on three independent experiments. *, P < 0.05; **, P < 0.01 determined by Student’s t test or two-way ANOVA with post hoc test.
Figure 2.
Figure 2.
Ezh2 deficiency neither affects the development and maturation of myeloid cells nor influences the activation of peripheral lymphoid cells. (A) Genotyping PCR analysis of tail DNA from Ezh2f/f, Ezh2+/+, Ezh2f/+, and LysM-cre mice. (B) Immunoblot analysis of Ezh2, H3K27me3, H3, and Hsp60 in bone marrow macrophages and splenocytes from Ezh2f/f LysM-cre (WT) and Ezh2f/f LysM-cre+ (Ezh2M−/−) mice. (C–F) Flow cytometry analysis of CD11b+F4/80+ macrophages (Ma), CD11b+Gr-1+ neutrophils (Neu), total CD11c+ DCs (DCs), CD11c+B220 conventional dendritic cells (cDCs), and CD11c+B220+ plasmacytoid dendritic cells (pDCs) in bone marrow (C and D) and in spleen (E and F) from WT and Ezh2M−/− mice. Data are presented as representative plots (C and E) and summary graphs (D and F). (G–I) Flow cytometry analysis of the cell numbers of total CD4+ and CD8+ T cells, CD4+ and CD8+ memory (CD62LlowCD44hi) and naive (CD62LhiCD44low) T cells, and CD4+CD25+Foxp3+ regulatory T (Treg) cells in spleen (G), PLN (peripheral lymph node; H), and MLN (mesenteric lymph node; I) from WT and Ezh2M−/− mice. The data are shown as mean ± SD based on three independent experiments. *, P < 0.05; **, P < 0.01 determined by Student’s t test.
Figure 3.
Figure 3.
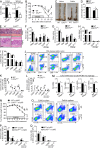
Ezh2 deficiency in myeloid cells suppresses DSS-induced colitis. (A) qRT-PCR analysis of Ezh2 mRNA in FACS-sorted CD11b+F4/80+macrophages from the colon and spleen of naive WT and Ezh2M−/− mice. (B) The body-weight loss of WT and Ezh2M−/− mice that were challenged with DSS in drinking water for 7 d. (C–E) The colon images (C), colon lengths (D), and representative H&E-stained images of proximal colon cross sections (E) of naive and DSS-challenged WT and Ezh2M−/− mice at day 12. Bars, 100 µm. (F and G) The frequencies (F) and absolute numbers (G) of the indicated immune cell populations in the colon of naive WT and Ezh2M−/− mice based on flow cytometry analysis. (H–L) Flow cytometry analysis of blood-circulating (H and I) and colon-infiltrated immune cell (J–L) of DSS-challenged WT and Ezh2M−/− mice (n = 4 mice per group) at day 6. Data are presented as representative plots (J) and summary graphs (H, I, K, and L). (M) qRT-PCR analysis of the indicated proinflammatory genes and Ezh2 mRNA in FACS-sorted colon infiltrated CD11b+F4/80+macrophages from DSS-challenged WT and Ezh2M−/− mice (n = 4 mice per group) at day 6. (N) The body-weight loss of WT and Ezh2M−/− mice that were deleted of CD11b+Gr-1+ neutrophils with anti-Ly6G antibody (α-Ly6G) and then challenged with DSS in drinking water for 7 d. (O–Q) Flow cytometry analysis of colon-infiltrated and spleen immune cells of DSS-challenged WT and Ezh2M−/− mice (n = 4 mice per group) that were deleted of neutrophils as described in N at day 6. The qRT-PCR data were normalized to a reference gene Actb (β-actin), and other data are shown as mean ± SD based on three independent experiments. *, P < 0.05; **, P < 0.01 determined by Student’s t test.
Figure 4.
Figure 4.
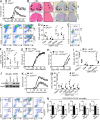
Microglia Ezh2 facilitates CNS autoimmune inflammation. (A) Mean clinical scores of age- and sex-matched WT and myeloid cell Ezh2-deficient (Ezh2M−/−) mice after the induction of EAE with MOG35–55 (n = 5 mice per group). (B) H&E and LFB staining of spinal cord sections from MOG35–55-immunized WT and Ezh2M−/− mice visualizing immune-cell infiltration and demyelination (arrows), respectively. Bars, 100 µm. Magnification of enlarged images, ×100. (C and D) Flow cytometry analysis of immune-cell infiltration into the CNS (brain and spinal cord) of MOG35–55-immunized WT and Ezh2M−/− mice (n = 5 mice per group) at day 14 after immunization. Data are presented as representative plots (C) and summary graphs (D). The numbers in the plots are the percentages of each gated cell population among the total CNS-infiltrated cells. (E and F) Frequency and absolute number of IFN-γ– and IL-17–producing effector T cells in the CNS (brain and spinal cord) of day 14 MOG35–55-immunized WT and Ezh2M−/− mice, shown as representative plots (E) and summary graphs (F). (G and H) Clinical scores after the induction of EAE in B6 mice that were adoptively transferred with WT or Ezh2M−/− bone marrow cells (n = 7 mice per group; G) or clinical scores after the induction of EAE in WT and Ezh2M−/− mice adoptively transferred with B6-SJL bone marrow cells (n = 5 mice per group; H). (I) Flow cytometry analysis of CNS-infiltrating immune cells of the MOG35–55-immunized WT and Ezh2M−/− SJL-chimeric mice at day 15 after immunization as described in H, showing a summary graph of the absolute cell numbers. (J) Immunoblot analysis of Ezh2 and Hsp60 expression in FACS-sorted CNS microglia (MG) and spleen CD11b+F4/80+ macrophages (Sp Mφ) from WT (Ezh2+/+Cx3cr1-creER-EYFP+) and microglia Ezh2-deficient (Ezh2Mg−/−, Ezh2f/fCx3cr1-creER-EYFP+) mice. (K) Mean clinical scores of age- and sex-matched WT and microglia Ezh2-deficient (Ezh2Mg−/−) mice that exposed with tamoxifen 30 d before immunization and then applied for EAE induction (n = 5 mice per group). (L and M) Flow cytometry analysis of immune-cell infiltration into the CNS (brain and spinal cord) of MOG35–55-immunized WT and Ezh2Mg−/− mice (n = 5 mice per group) at day 14 after immunization. Data are presented as representative plots (L) and summary graphs (M). (N) qRT-PCR analysis of the indicated genes in FACS-sorted CNS CD45.1CD11b+ microglia of MOG35–55-immunized WT and Ezh2M−/− SJL-chimeric mice (n = 5 mice per group) on day 14 after immunization. The qRT-PCR data were normalized to a reference gene Actb (β-actin), and other data are shown as the mean ± SD based on three independent experiments. *, P < 0.05; **, P < 0.01 determined by Student’s t test.
Figure 5.
Figure 5.
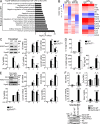
Ezh2 mediates MyD88-dependent inflammatory responses in macrophages/microglia. (A) GO term analysis of Ezh2 function in macrophages treated with LPS through DAVID informatics shows that the most significantly enriched biological process is related to immune system process. (B) RNA-Seq analysis by using WT and Ezh2-deficient macrophages left nontreated (NT) or stimulated for 2 h with LPS, showing the heat maps of genes with adjusted P value <0.05, false discovery rate <0.05, and log2 fold-change >1.2 (left) and the indicated proinflammatory cytokine and chemokine genes down-regulated in Ezh2-deficient macrophages relative to WT cells that treated with LPS for 2 h (right). The source RNA-Seq data were deposited into the Gene Expression Omnibus with the accession no. GSE101316. (C and E) Immunoblot analysis of Ezh2, H3K27me3, H3, and Hsp60, showing the efficiency of Ezh2 deletion and H3K27me3 inhibition in Ezh2-deficient macrophages (C) or microglia (E) compared with WT cells, and qRT-PCR determining the relative expression of indicated proinflammatory genes in macrophages (C) or microglia (E) from WT and Ezh2M−/− mice treated with LPS at the indicated time points. (D) ELISA showing the production of IL-6, IL-12p40, and TNF in the culture supernatants of WT and Ezh2-deficient macrophages that were left nontreated (NT) or treated for 24 h with LPS. (F) qRT-PCR analysis of the indicated genes (left) and IB analysis of Ezh2, H3K27me3, H3, and Hsp60 (right) in CRISPR/Cas9-mediated Ezh2 knockout BV2 microglial cells that were infected with EV or lentiviral vector encoding WT Ezh2 or its SET domain deletion mutant (ΔSET), left nontreated (NT), or treated for 6 h with LPS. Data were normalized to a reference gene, Actb (β-actin), and shown as mean ± SD based on three independent experiments. *, P < 0.05; **, P < 0.01 determined by Student’s t test.
Figure 6.
Figure 6.
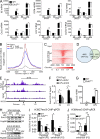
Ezh2 epigenetically controls Socs3 expression in macrophages/microglia. (A) qRT-PCR analysis of the indicated genes in WT and Ezh2-deficient macrophages that were pretreated with DMSO or cycloheximide (CHX) for 1 h and then left nontreated (NT) or stimulated with LPS for 6 h. (B) Mean Ezh2 ChIP signal in WT macrophages that were left nontreated (NT) or stimulated for 2 h with LPS (100 ng/ml). (C) Heat maps of Input and Ezh2 ChIP-Seq signals at TSSs (±3 kb) in WT bone marrow–derived macrophage left nontreated (NT) or stimulated for 2 h with LPS. The source ChIP-Seq data were deposited into the Gene Expression Omnibus with the accession no. GSE101320. (D) Venn diagram showing the numbers of genes harboring Ezh2 peaks and displaying up-regulation in LPS-stimulated macrophages. (E) Snapshot of the Ezh2 ChIP-Seq signal at the Socs3 loci in WT macrophages left nontreated (NT) or stimulated for 2 h with LPS; the arrows indicate the location of the ChIP primer pairs (P1 and P2). (F) ChIP-qPCR analysis of Ezh2 binding to the Socs3 loci in WT macrophages left nontreated (NT) or stimulated for 2 h with LPS. (G and H) qRT-PCR and IB analysis of Socs3 mRNA and protein levels in WT and Ezh2-deficient macrophages (G, upper panel of H) and Ezh2-KO BV2 cells that infected with EV or lentiviral vector encoding WT Ezh2 (lower panel of H), left nontreated (NT) or stimulated with LPS for 6 h (qPCR) or 12 h (IB). The relative expression of Socs3 compared with Hsp60 was quantified and presented below the Socs3 IB panels. (I and J) ChIP-qPCR analysis of H3K27me3 (I) and H3K4me3 (J) modifications at the Socs3 loci in WT and Ezh2-deficient macrophages left nontreated (NT) or stimulated for 2 h with LPS. The qRT-PCR data were normalized to a reference gene, Actb (β-actin), and other data are shown as mean ± SD based on three independent experiments. *, P < 0.05; **, P < 0.01 determined by Student’s t test.
Figure 7.
Figure 7.
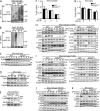
Ezh2 regulates TRAF6 degradation and its downstream signaling. (A and B) Analysis of TRAF6 Lys48-linked ubiquitination in WT and Ezh2-deficient macrophages (A) or in Ezh2-KO BV2 cell that infected with EV or lentiviral vector encoding WT Ezh2 (B) that was stimulated with LPS at the indicated time points. (C–E) IB analysis of TRAF6 protein levels in WT and Ezh2-deficient macrophages (C), in microglia (D), or in Ezh2-KO BV2 cells that were infected with EV or lentiviral vector encoding WT Ezh2 (E) that was stimulated without or with LPS at the indicated time points. The relative expression of Traf6 compared with loading controls (Actin or Hsp60) was quantified and presented below the Traf6 IB panels. (F and G) qRT-PCR analysis of Traf6 mRNA expression in WT and Ezh2-deficient macrophages (F) or microglia (G) that was stimulated with LPS at the indicated time points. (H–K) Immunoblot analysis of phosphorylated (P-) and total NF-κB and MAPKs signaling proteins, H3K27me3, H3, Ezh2, or Hsp60 (loading control) in whole-cell lysates of WT and Ezh2-deficient macrophages that were left unstimulated or stimulated with LPS (100 ng/ml; H) or Pam3CSK4 (100 ng/ml; I) or poly I:C (pI:C, 20 µg/ml; J), and IB of the indicated signal protein in the whole-cell lysates of WT and Ezh2-deficient primary microglia that were left unstimulated or stimulated with LPS (100 ng/ml; K) at the indicated time points. The qRT-PCR data were normalized to a reference gene, Actb (β-actin), and other data are shown as mean ± SD based on three independent experiments.
Figure 8.
Figure 8.
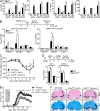
Inhibition of Socs3 restores autoimmune inflammation in Ezh2-deficient mice. (A) qRT-PCR determining the relative expression of the indicated genes in WT and Ezh2-deficient macrophages that infected with retrovirus carrying control vector (shCtr) or Socs3 shRNA (shS3 #1 and shS3 #2), left nontreated (NT) or stimulated with LPS for 6 h. (B) Upper panel: scheme of how Socs3 was knocked down in vivo in WT and Ezh2M−/− mice that applied for DSS challenge. Lower panel: qRT-PCR determining Socs3 mRNA expression in FACS-sorted colon and spleen immune-cell populations in WT and Ezh2M−/− mice that were i.v. injected with retrovirus carrying control vector (shCtrl) or Socs3 shRNA (shSocs3). (C) The body-weight loss of WT and Ezh2M−/− mice that were knocked down Socs3 as described in B and then challenged with DSS in drinking water for 7 d. (D) Upper panel: scheme of how Socs3 was knocked down in vivo in WT and Ezh2Mg−/− mice that applied for EAE induction. Ta, tamoxifen. Lower panel: qRT-PCR determining Socs3 mRNA expression in FACS-sorted CNS YFP+ microglia and spleen CD11b+F4/80+ macrophages in WT (Ezh2+/+Cx3cr1-creER-EYFP+) and Ezh2Mg−/− (Ezh2f/fCx3cr1-creER-EYFP+) mice that were exposed by tamoxifen and then were immunized with MOG peptide to induce EAE and i.v. injected with retrovirus carrying control vector (shCtrl) or Socs3 shRNA (shSocs3) at the indicated time points. (E) Mean clinical scores of WT and Ezh2Mg−/− mice that were knocked down Socs3 and applied for EAE induction as described in D. (F) H&E and LFB staining of spinal cord sections from MOG35–55-immunized mice as described in D, visualizing immune-cell infiltration and demyelinization (arrows), respectively. Bars, 100 µm. The qRT-PCR data were normalized to a reference gene, Actb (β-actin), and the other data are shown as mean ± SD based on three independent experiments. *, P < 0.05; **, P < 0.01 determined by Student’s t test.
Figure 9.
Figure 9.
Model of Ezh2 in the regulation of macrophages/microglia activation and autoimmune inflammation. In WT macrophages/microglia, Ezh2, together with EED and Suz12 form PRC2 complex, which directly target Socs3 to promote the H3K27me3 and suppress the expression of Socs3, lead to uncontrolled TLR-induced NF-κB activation and increased proinflammatory gene expression, therefore finally promoting the autoimmune inflammation. Whereas in Ezh2-deficient cells, Ezh2 depletion caused a substantial reduction of H3K27me3 levels, incensement of H3K4me3 at the Socs3 gene enhancer region induced the up-regulation of Socs3. Socs3 in turn mediated the Lys48-linked ubiquitination and degradation of TRAF6, leading to the suppression of TLR-induced MyD88-dependent NF-κB activation and the inhibition of genes involved in macrophage/microglial activation and autoimmune inflammation.

Comment in

Similar articles

Cited by

References

    1. Ajami B., Bennett J.L., Krieger C., McNagny K.M., and Rossi F.M.. 2011. Infiltrating monocytes trigger EAE progression, but do not contribute to the resident microglia pool. Nat. Neurosci. 14:1142–1149. 10.1038/nn.2887 - DOI - PubMed
    1. Akira S., Uematsu S., and Takeuchi O.. 2006. Pathogen recognition and innate immunity. Cell. 124:783–801. 10.1016/j.cell.2006.02.015 - DOI - PubMed
    1. Asquith M.J., Boulard O., Powrie F., and Maloy K.J.. 2010. Pathogenic and protective roles of MyD88 in leukocytes and epithelial cells in mouse models of inflammatory bowel disease. Gastroenterology. 139:519–529, 529.e1–529.e2. 10.1053/j.gastro.2010.04.045 - DOI - PMC - PubMed
    1. Chassaing B., Aitken J.D., Malleshappa M., and Vijay-Kumar M.. 2014. Dextran sulfate sodium (DSS)-induced colitis in mice. Curr. Protoc. Immunol. 104:15.25.1–15.25.14 - PMC - PubMed
    1. Chastain E.M., Duncan D.S., Rodgers J.M., and Miller S.D.. 2011. The role of antigen presenting cells in multiple sclerosis. Biochim. Biophys. Acta. 1812:265–274. 10.1016/j.bbadis.2010.07.008 - DOI - PMC - PubMed

Publication types

MeSH terms