. 2018 Mar 16;359(6381):1277-1283.
doi: 10.1126/science.aag3048. Epub 2018 Mar 15.

Lysosome activation clears aggregates and enhances quiescent neural stem cell activation during aging

Affiliations

Lysosome activation clears aggregates and enhances quiescent neural stem cell activation during aging

Dena S Leeman et al. Science. .

Abstract

In the adult brain, the neural stem cell (NSC) pool comprises quiescent and activated populations with distinct roles. Transcriptomic analysis revealed that quiescent and activated NSCs exhibited differences in their protein homeostasis network. Whereas activated NSCs had active proteasomes, quiescent NSCs contained large lysosomes. Quiescent NSCs from young mice accumulated protein aggregates, and many of these aggregates were stored in large lysosomes. Perturbation of lysosomal activity in quiescent NSCs affected protein-aggregate accumulation and the ability of quiescent NSCs to activate. During aging, quiescent NSCs displayed defects in their lysosomes, increased accumulation of protein aggregates, and reduced ability to activate. Enhancement of the lysosome pathway in old quiescent NSCs cleared protein aggregates and ameliorated the ability of quiescent NSCs to activate, allowing them to regain a more youthful state.


Conflict of interest statement

Competing interests: None declared.

Figures

Fig. 1
Fig. 1. qNSCs exhibit a protein quality-control signature distinct from their activated progeny, with enlarged lysosomes
(A) Experimental design. Endo, endothelial cell; Ast, astrocyte; EGFR, epidermal growth factor receptor. (B) PCA of five cell types and two ages, performed on variance stabilizing transformation (VST)–normalized read counts of all detected genes. PC, principal component. (C) Selected KEGG pathways significantly upregulated in qNSCs or aNSCs. P values determined by bootstrap sampling, with Benjamini-Hochberg correction. *False discovery rate (FDR)–adjusted P ≤ 0.05; **FDR-adjusted P ≤ 0.001; ***FDR-adjusted P ≤ 0.0001. See also fig. S3 and table S5. (D) Heatmap showing expression levels of all genes in pathways from the three main branches of proteostasis: proteasome, lysosome, and chaperones. VST-normalized read counts, scaled row-wise. V-ATPase, vacuolar H+–adenosine triphosphatase. See also table S6. (E) Median fluorescence of LAMP-1 normalized to cell size, as measured by flow cytometry. Mean ± SEM of values from six different mice (3 to 4 months old) analyzed on a single day. Each point represents FACS-sorted cells from a single mouse. P value determined by one-sided Wilcoxon rank sum test. **P ≤ 0.01. (F and G) Representative immunofluorescence images of primary cultures of qNSCs and aNSCs from 3-month-old mice stained with (F) LAMP-2 (green, lysosomal membranes) and 4′,6-diamidino-2-phenylindole (DAPI) (blue, nuclei) or (G) LysoTracker (red, acidic organelles) and Hoechst (blue, nuclei). Scale bars, 5 μm. See also figs. S5B and S9B. (H) Top: In cells expressing mCherry-GFP-LC3, autophagosomes display both GFP and mCherry fluorescence (yellow-green), whereas autolysosomes display only mCherry fluorescence (red) because GFP is denatured by the acidity of the lysosome. Bottom: Representative images of GFP and mCherry fluorescence in primary cultures of qNSCs and aNSCs from 3-month-old mice. Scale bars, 5 μm. See also fig. S5C. (I) Fluorescence level of Me4BodipyFL-Ahx3Leu3VS, a probe that covalently binds active proteasomes, in populations directly isolated from the brain. Mean ± SEM of values from four different mice (3 to 4 months old) sorted and analyzed on two different days. Each point represents cells from a single mouse. P value determined by one-sided Wilcoxon rank sum test. *P ≤ 0.05.
Fig. 2
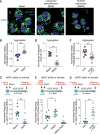
Fig. 2. qNSCs have insoluble protein aggregates localized in large lysosomes
(A) Representative immunofluorescence images of qNSC and aNSC primary cultures from 3-month-old mice stained with Proteostat (magenta, protein aggregates), LAMP-2 (green, lysosomal membranes), and DAPI (blue, nuclei). Scale bars, 5 μm. (B) Median fluorescence of Proteostat normalized to cell size and to the median value on the day of measurement (to combine independent experiments). Mean ± SEM of values from 10 different mice (3 to 4 months old) analyzed by flow cytometry on four different days. Each point represents FACS-sorted cells from a single mouse. P value determined by two-sided Wilcoxon rank sum test. **P ≤ 0.01. (C) Representative SDS-PAGE gel stained with SYPRO Ruby for detection of protein in the total, soluble, and insoluble fractions of qNSCs and aNSCs. See also fig. S6, C to E.
Fig. 3
Fig. 3. Modulation of lysosomal activity in qNSCs affects protein aggregates and the transition from quiescence to activation
(A) Representative immunofluorescence images of primary cultures of qNSCs from 3-month-old mice after 18 hours of treatment with 50 nM bafilomycin A (BafA, a lysosomal V-ATPase inhibitor) or 3 hours of nutrient deprivation in HBSS. Cells are stained with Proteostat (magenta, protein aggregates), LAMP-2 (green, lysosomal membranes), and DAPI (blue, nuclei). Scale bars, 5 μm. Basal, quiescence media. (B) Median Proteostat fluorescence normalized to the median value per replicate to combine samples prepared at different times. Mean ± SEM of values from six biological replicates analyzed by flow cytometry on two different days. Each point represents an independent primary culture derived from two 3- to 4-month-old mice. (C) Percentage of cells that incorporated 5-ethynyl-2′-deoxyuridine (EdU) (cells in S phase of the cell cycle) during a 3-hour pulse, as measured by intracellular flow cytometry. Mean ± SEM of values from nine different biological replicates analyzed on four different days. Each point represents one independent primary culture derived from two 3- to 4-month-old mice. (D) Differences in Proteostat+ area quantified from images. Mean ± SEM of values from five independent biological replicates from two independent experiments. (E) Percentage of cells that incorporated EdU measured as in (C). Mean ± SEM of values from nine different biological replicates analyzed on four different days. (F) Proteostat fluorescence measured as in (B). Mean ± SEM of values from nine biological replicates analyzed on three different days. rtTA, reverse tetracycline-controlled transactivator. (G) Percentage of cells that incorporated EdU measured as in (C). Mean ± SEM of values from six different biological replicates analyzed on two different days. For all panels, P values determined by one-sided Wilcoxon rank sum test. *P ≤ 0.05; **P ≤ 0.01.
Fig. 4
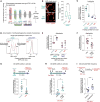
Fig. 4. Old qNSCs show lysosome defects, increased protein aggregates, and decreased activation, but these can be counteracted by lysosomal activation
(A) Log2 fold changes between young (3- to 4-month-old) and old (19- to 22-month-old) samples of each cell type for all detected genes using DESeq2 (36). Each point represents one gene. Genes in color are significantly (“sig.”) up- or down-regulated with age with FDR = 0.05. Genes in gray are not significantly up- or down-regulated with age. (B) SVZ whole-mount staining of young (3-month-old) and old (21-month-old) qNSCs. Left: LAMP-1 (lysosomes, yellow) staining in qNSCs identified by the combination of a KI67-negative cell soma and a GFAP+ (red) projection through ependymal cell pinwheels at the ventricular surface (KI67, proliferation marker). Scale bar, 2 μm. Right: Quantification of LAMP-1 fluorescence intensity in qNSCs normalized for cell size from three young and three old mice (n = 65 qNSCs). (C) Median fluorescence of LAMP-1 normalized for cell size. Mean ± SEM of values from three to four young and old mice, analyzed by flow cytometry on a single day. Each point represents FACS-sorted cells from a single mouse. (D) Representative histograms of the GFP-LC3 fluorescence per cell in qNSC and aNSC populations from a 5-month-old versus 25-month-old transgenic GFP-LC3 mouse, as measured by flow cytometry. See also fig. S9, C and D. (E) Median fluorescence of Proteostat in GFP-LC3-high qNSCs and aNSCs and NPCs from young (2- to 5-month-old) and old (25-month-old) GFP-LC3 mice normalized to the median value per replicate to combine samples prepared at different times. Mean ± SEM of values from three to four different mice analyzed by flow cytometry on a single day. Each point represents cells FACS-sorted from a single mouse. (F) Median fluorescence of Proteostat normalized to the median value per replicate. Mean ± SEM of values from nine biological replicates analyzed on three different days. Each point represents one independent primary culture derived from a 17- to 22-month-old mouse. (G) Percentage of cells in an individual culture that incorporated EdU (cells in S phase) during a 3-hour pulse, as measured by intracellular flow cytometry. Mean ± SEM of values from six different biological replicates analyzed on two different days. Each point represents one independent primary culture derived from two 3-month-old or 20-month-old mice. (H) Percentage of cells that incorporated EdU measured as in (G). Mean ± SEM of values from six different biological replicates analyzed on two different days. Each point represents one independent primary culture derived from a 17- to 22-month-old mouse. (I) Old mice (22 months old) were treated for 3 months with rapamycin in mouse chow. SVZ composition was then analyzed by FACS. Each point represents the abundance of aNSCs and aNPCs (EGFR+CD24CD31CD45 cells) in a single mouse, expressed as the percentage of total live cells in the SVZ. Mean ± SEM of values from six to seven different mice. P values [except panel (B)] determined by one-sided Wilcoxon rank sum test; Panel (B) P values determined by two-sided Wilcoxon rank sum test. *P ≤ 0.05; **P ≤ 0.01; ***P ≤ 0.01.

Comment in

Similar articles

Cited by

References

    1. Balch WE, Morimoto RI, Dillin A, Kelly JW. Science. 2008;319:916–919. - PubMed
    1. Hipp MS, Park SH, Hartl FU. Trends Cell Biol. 2014;24:506–514. - PubMed
    1. Wong E, Cuervo AM. Cold Spring Harb Perspect Biol. 2010;2:a006734. - PMC - PubMed
    1. Vilchez D, Simic MS, Dillin A. Trends Cell Biol. 2014;24:161–170. - PubMed
    1. Lim DA, Alvarez-Buylla A. Cold Spring Harb Perspect Biol. 2016;8:a018820. - PMC - PubMed

Publication types