

Sequential regulatory activity prediction across chromosomes with convolutional neural networks
- PMID: 29588361
- PMCID: PMC5932613
- DOI: 10.1101/gr.227819.117
Sequential regulatory activity prediction across chromosomes with convolutional neural networks
Abstract
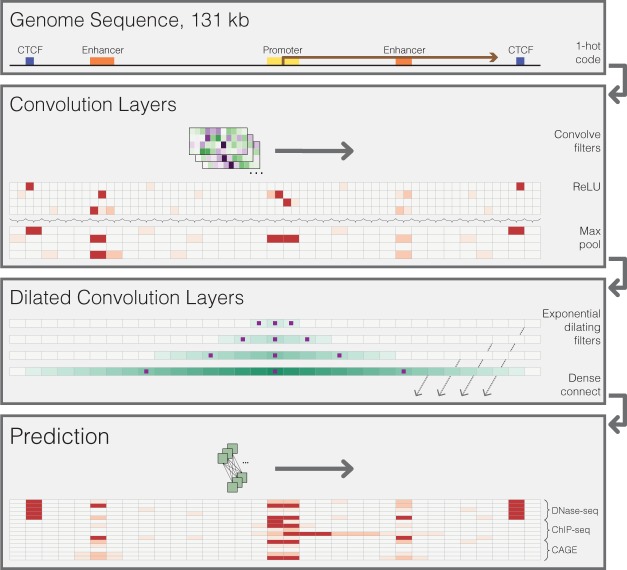
Models for predicting phenotypic outcomes from genotypes have important applications to understanding genomic function and improving human health. Here, we develop a machine-learning system to predict cell-type-specific epigenetic and transcriptional profiles in large mammalian genomes from DNA sequence alone. By use of convolutional neural networks, this system identifies promoters and distal regulatory elements and synthesizes their content to make effective gene expression predictions. We show that model predictions for the influence of genomic variants on gene expression align well to causal variants underlying eQTLs in human populations and can be useful for generating mechanistic hypotheses to enable fine mapping of disease loci.
© 2018 Kelley et al.; Published by Cold Spring Harbor Laboratory Press.
Figures
Similar articles
-
Cross-species regulatory sequence activity prediction.PLoS Comput Biol. 2020 Jul 20;16(7):e1008050. doi: 10.1371/journal.pcbi.1008050. eCollection 2020 Jul. PLoS Comput Biol. 2020. PMID: 32687525 Free PMC article.
-
Integrating distal and proximal information to predict gene expression via a densely connected convolutional neural network.Bioinformatics. 2020 Jan 15;36(2):496-503. doi: 10.1093/bioinformatics/btz562. Bioinformatics. 2020. PMID: 31318408
-
The impact of different negative training data on regulatory sequence predictions.PLoS One. 2020 Dec 1;15(12):e0237412. doi: 10.1371/journal.pone.0237412. eCollection 2020. PLoS One. 2020. PMID: 33259518 Free PMC article.
-
Fundamentals for predicting transcriptional regulations from DNA sequence patterns.J Hum Genet. 2024 Oct;69(10):499-504. doi: 10.1038/s10038-024-01256-3. Epub 2024 May 10. J Hum Genet. 2024. PMID: 38730006 Free PMC article. Review.
-
Cluster analysis and promoter modelling as bioinformatics tools for the identification of target genes from expression array data.Pharmacogenomics. 2001 Feb;2(1):25-36. doi: 10.1517/14622416.2.1.25. Pharmacogenomics. 2001. PMID: 11258194 Review.
Cited by
-
Machine-guided design of cell-type-targeting cis-regulatory elements.Nature. 2024 Oct;634(8036):1211-1220. doi: 10.1038/s41586-024-08070-z. Epub 2024 Oct 23. Nature. 2024. PMID: 39443793 Free PMC article.
-
Computational Characterization of Undifferentially Expressed Genes with Altered Transcription Regulation in Lung Cancer.Genes (Basel). 2023 Dec 1;14(12):2169. doi: 10.3390/genes14122169. Genes (Basel). 2023. PMID: 38136991 Free PMC article.
-
Variants in tubule epithelial regulatory elements mediate most heritable differences in human kidney function.bioRxiv [Preprint]. 2024 Jun 22:2024.06.18.599625. doi: 10.1101/2024.06.18.599625. bioRxiv. 2024. Update in: Nat Genet. 2024 Oct;56(10):2078-2092. doi: 10.1038/s41588-024-01904-6. PMID: 38948875 Free PMC article. Updated. Preprint.
-
Genome annotation across species using deep convolutional neural networks.PeerJ Comput Sci. 2020 Jun 15;6:e278. doi: 10.7717/peerj-cs.278. eCollection 2020. PeerJ Comput Sci. 2020. PMID: 33816929 Free PMC article.
-
Current genomic deep learning models display decreased performance in cell type specific accessible regions.bioRxiv [Preprint]. 2024 Jul 10:2024.07.05.602265. doi: 10.1101/2024.07.05.602265. bioRxiv. 2024. Update in: Genome Biol. 2024 Aug 1;25(1):202. doi: 10.1186/s13059-024-03335-2. PMID: 39026761 Free PMC article. Updated. Preprint.
References
-
- Abadi M, Barham P, Chen J, Chen Z, Davis A, Dean J, Devin M, Ghemawat S, Irving G, Isard M, et al. 2016. TensorFlow: a system for large-scale machine learning. In USENIX symposium on operating systems design and implementation, Savannah, GA.
-
- Albert FW, Kruglyak L. 2015. The role of regulatory variation in complex traits and disease. Nat Rev Genet 16: 197–212. - PubMed
-
- Alipanahi B, Delong A, Weirauch MT, Frey BJ. 2015. Predicting the sequence specificities of DNA- and RNA-binding proteins by deep learning. Nat Biotechnol 33: 831–838. - PubMed
-
- Ayoubi TA, Van De Ven WJ. 1996. Regulation of gene expression by alternative promoters. FASEB J 10: 453–460. - PubMed
MeSH terms
Grants and funding
LinkOut - more resources
Full Text Sources
Other Literature Sources