. 2018 Mar 26;14(3):e1006954.
doi: 10.1371/journal.ppat.1006954. eCollection 2018 Mar.

HSV-1-induced disruption of transcription termination resembles a cellular stress response but selectively increases chromatin accessibility downstream of genes

Affiliations

HSV-1-induced disruption of transcription termination resembles a cellular stress response but selectively increases chromatin accessibility downstream of genes

Thomas Hennig et al. PLoS Pathog. .

Abstract

Lytic herpes simplex virus 1 (HSV-1) infection triggers disruption of transcription termination (DoTT) of most cellular genes, resulting in extensive intergenic transcription. Similarly, cellular stress responses lead to gene-specific transcription downstream of genes (DoG). In this study, we performed a detailed comparison of DoTT/DoG transcription between HSV-1 infection, salt and heat stress in primary human fibroblasts using 4sU-seq and ATAC-seq. Although DoTT at late times of HSV-1 infection was substantially more prominent than DoG transcription in salt and heat stress, poly(A) read-through due to DoTT/DoG transcription and affected genes were significantly correlated between all three conditions, in particular at earlier times of infection. We speculate that HSV-1 either directly usurps a cellular stress response or disrupts the transcription termination machinery in other ways but with similar consequences. In contrast to previous reports, we found that inhibition of Ca2+ signaling by BAPTA-AM did not specifically inhibit DoG transcription but globally impaired transcription. Most importantly, HSV-1-induced DoTT, but not stress-induced DoG transcription, was accompanied by a strong increase in open chromatin downstream of the affected poly(A) sites. In its extent and kinetics, downstream open chromatin essentially matched the poly(A) read-through transcription. We show that this does not cause but rather requires DoTT as well as high levels of transcription into the genomic regions downstream of genes. This raises intriguing new questions regarding the role of histone repositioning in the wake of RNA Polymerase II passage downstream of impaired poly(A) site recognition.


Conflict of interest statement

The authors have declared that no competing interests exist.

Figures
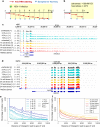
Fig 1
Fig 1. Experimental set-up and read distribution downstream of genes.
(a-b) Experimental set-up of our original 4sU-seq time-course for HSV-1 infection [10] (a) and for the analysis of DoG transcription in salt and heat stress (b). 4sU-tagging was performed in 1h intervals before infection and stress as well as for the first 8h of HSV-1 infection and for the first 2h of salt and heat stress. Two biological 4sU-RNA replicates of each condition were subjected to Illumina sequencing (4sU-seq). (c-d) 4sU-seq read coverage (= number of mapped sequencing reads, sum of 2 replicates) for the genes SRSF3 (c) and GAPDH (d) in uninfected/untreated samples (gray), during HSV-1 infection (cyan) and in salt (yellow) and heat (red) stress. Read coverage ranges are indicated in square brackets on the y-axis. Only reads mapping to the corresponding strand are shown. RefSeq gene annotation is indicated below (blue). Boxes indicate coding regions and untranslated regions (UTRs; narrow boxes) and lines intronic regions. The transcribed strand is indicated by the direction of the arrowheads. (e-f) Distribution of reads mapping in sense direction downstream of annotated gene 3’ ends in HSV-1 infection (e) and salt and heat stress (f) (shown separately for the two replicates: solid lines = replicate 1, dashed lines = replicate 2). Only gene 3’ ends with no gene on either strand within the 100kb downstream region were considered. Read counts in sense direction to the gene were determined in 2kb windows downstream of gene 3’ ends and divided by window length and the total number of mapped reads. Reads counts mapping to the antisense strand are shown in Fig B in S3 File.
Fig 2
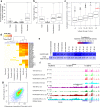
Fig 2. Global characteristics of DoTT/DoG transcription in salt and heat stress and HSV-1 infection.
(a) Boxplots showing the distribution of read-through in salt (orange) and heat stress (red) and HSV-1 infection (cyan). Results for individual replicates are shown in Fig D in S3 File. (b) Median read-through values for each condition and time-point are plotted against the standard deviation in gene expression (= gene FPKM) fold-changes (log2). The gray curve indicates the result of a locally weighted polynomial regression (LOWESS) on all HSV-1 infection time-points. Spearman correlation (Cor) between median read-through and standard deviation in log2 expression fold-changes across all samples is also indicated. (c) 6-mers whose frequency in the 100nt up- or downstream of gene 3’ ends is significantly correlated to read-through in at least one sample (FDR adjusted p<0.0001). FDR adjusted p-values for all samples are color-coded (red for negative correlations, blue for positive correlations). (d) Boxplots showing the distribution of read-through in 2h salt and heat stress and 4-5h and 7-8h p.i. for genes without (w/o) or with (w/) at least one occurrence of the AAUAAA motif in the 100nt upstream of gene 3’ends. P-values of Wilcoxon rank sum tests comparing read-through in each sample between the two groups are indicated above the x-axis.
Fig 3
Fig 3. Comparison of DoTT/DoG transcription and association with aberrant splicing.
(a) Spearman correlation for read-through values between all samples. (b) Heatmap of read-though for all 3,682 analyzed genes in salt and heat stress and HSV-1 infection (excluding the first two time-points with very low levels of read-through). Colors indicate read-though >5%. Hierarchical clustering was performed using average linkage clustering based on Euclidean distances. (c) Heatmap of read counts (sum of 2 replicates) for intergenic splicing events connecting exons of neighboring genes on the same strand. Junctions are annotated with the upstream and downstream gene symbol. Results for the intergenic splicing junction connecting SRSF2 and JMJD6 are highlighted by a blue box. Only junctions are shown with >2 reads covering at least 5bp of both exons in either 2h salt stress, 2h heat stress or 7-8h p.i. HSV-1 infection. Hierarchical clustering was performed as for (b). (d) Percentage of splicing junctions that are part of protein-coding transcripts, novel (using either 2 or 1 known exon boundary), nonsense-mediated-decay (NMD)-associated or only observed in a processed transcript. Results are shown separately for non-regulated, up-regulated and down-regulated junctions (see methods for definition) for 2h salt and heat stress and 4–5hs and 7-8h p.i. HSV-1 infection.
Fig 4
Fig 4. Role of Ca2+ release and IP3R in DoTT/DoG transcription.
(a) HFF were exposed to 1h salt stress in presence of (i) an inhibitor of IP3R signaling (2-APB), (ii) the membrane permeable Ca2+ chelator BAPTA-AM, or (iii) inhibitors of CaMKII and PKC/D (KN93 and Gö6976, respectively, Gö/Kn in Figure). DoTT/DoG transcription was quantified in total cellular RNA by qRT-PCR for DDX18. (b) HFF were infected with wildtype HSV-1 at an MOI of 10 and BAPTA-AM was added at 1h p.i. to the cell culture medium. Viral gene expression of ICP0 (immediate-early), ICP8 (early) and ICP5 (late kinetics) were quantified at 8h p.i. by qRT-PCR. (c) The effect of BAPTA-AM on Pol II activity was determined for three genes in 4sU-RNA obtained following 60min of 500μM 4sU-tagging in presence of either Act-D (positive control) or BAPTA-AM. Cells were pretreated with either of the two drugs or DMSO for 30min prior to 4sU-tagging. For all experiments (a-c), combined data of three biological replicates are shown. (d) Effects of BAPTA-AM on global transcription rates were determined by dot blot analysis of thiol-specifically biotinylated total cellular RNA obtained from cells following 60min of 500µM 4sU exposure in presence of BAPTA-AM, Act-D (global inhibition of transcription) or mock. A biotinylated DNA oligo (1biotin in 40nt) served as positive control (PC). A representative of three independent experiments is shown. (e) The effect of BAPTA-AM, 2-APB, and Gö6976 / KN93 co-treatment on Pol I (18S rRNA), Pol II (GAPDH, SRSF3, IRF1, DDX18) and Pol III (5S rRNA) transcriptional activity were quantified in purified 4sU-RNA obtained following 60min of 4sU-tagging during the first and second hour of salt stress. Equal amounts of input RNA (60μg biotinylated RNA) were used to purify 4sU-RNA and data were normalized to this. (f) In the same experiment, transcriptional activity downstream of SRSF3, IRF1 and DDX18 was quantified by qRT-PCR and compared to transcription rates within the respective gene bodies. Data from two biological replicates are shown. BAPTA-AM treatment did not allow recovering sufficient amounts of RNA for quantification.
Fig 5
Fig 5. Subcellular localization of read-through transcripts in HSV-1 infection.
(a) Boxplots indicating the distribution of the percentage of transcription downstream of genes identified before infection in total, cytoplasmic, nucleoplasmic and chromatin-associated RNA. Numbers in boxes indicate median values. (b) Boxplots indicating the distribution of read-through at 8h p.i. HSV-1 infection in all RNA fractions. Numbers in boxes indicate median values. (c) Boxplots indicating the distribution of log2 ratios of nucleoplasm enrichment (= gene FPKM in nucleoplasmic RNA/ gene FPKM in cytoplasmic RNA) at 8h p.i. compared to uninfected cells. Ratios are shown separately for groups of genes with different amounts of read-through in 7-8h p.i. 4sU-RNA. The value for IRF1 is highlighted in red. (d) Heatmap of read counts (sum of 2 replicates) in total, cytoplasmic, nucleoplasmic and chromatin-associated RNA for the intergenic splicing events shown in Fig 3C. Results for the intergenic splicing junction connecting SRSF2 and JMJD6 are highlighted by a blue box. (e) Spearman correlation between read-through (calculated from 4sU-seq data) in all conditions and the percentage of transcription downstream of genes identified in chromatin-associated RNA of uninfected/untreated cells. Correlation to mock read-through values is shown below. Mock read-through values were calculated as described in methods and correlations were averaged for each condition. (f) Mapped sequencing reads (negative strand) for total (light/dark pink), cytoplasmic (light/dark green), nucleoplasmic (light/dark red) and chromatin-associated RNA (light/dark cyan) in uninfected cells (light colors) and at 8h p.i. (dark colors) for the IRF1 gene. Read coverage ranges and RefSeq gene annotation are indicated as in Fig 1C. (g) Scatterplot of read-through at 2-3h p.i. against the percentage of transcription downstream of genes identified in chromatin-associated RNA of uninfected/untreated cells. Colors indicate density of points (red = highest density, blue = lowest density).
Fig 6
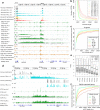
Fig 6. Extensive increase of downstream open chromatin during HSV-1 infection.
(a) 4sU-seq read coverage for SRSF3 (strand-specific, grey = uninfected/unstressed, cyan = selected time-points of HSV-1 infection, yellow = 2h salt stress, red = 2h heat stress) as well as ATAC-seq data (no strand specificity, green = HSV-1 infection, brown = salt and heat stress) and identified open chromatin regions (OCRs, black lines). The OCRs shown here were derived from replicate 1. Read coverage ranges and RefSeq gene annotation are indicated as described in Fig 1C. (b) Numbers of identified OCRs (y-axis) with a certain minimum length (x-axis) for all ATAC-seq samples. Results for replicates are shown separately (solid lines = replicate 1, dashed lines = replicate 2). (c) Empirical cumulative distribution functions indicating the fraction of genes (y-axis) with at most a certain dOCR length (average between two replicates) at 6h p.i. (x-axis). Genes were grouped according to read-through in 7-8h p.i. as described in methods. (d) 4sU-seq and ATAC-seq read coverage and identified OCRs in HSV-1 infection for the FBN2 and SLC12A2 genes. 4sU-seq reads are shown separately for positive [+] and negative [–] strand. ATAC-seq reads are not strand-specific. Read coverage ranges and RefSeq gene annotations are indicated as in Fig 1C. (e) Boxplots indicating the distribution of gene expression (FPKM) values for genes with >80% read-through at 7-8h p.i. and dOCR length of either ≥5kb (white) or <5kb (gray.) (f) Empirical cumulative distribution functions indicating the fraction of genes (y-axis) with at most a certain downstream dOCR length at 6h p.i. (x-axis) for highly-expressed genes (FPKM at 7-8h p.i. ≥2). Genes were grouped according to read-through in 7-8h p.i. as described in methods.

Similar articles

Cited by

References

    1. Porrua O, Libri D. Transcription termination and the control of the transcriptome: why, where and how to stop. Nat Rev Mol Cell Biol. 2015;16(3):190–202. doi: 10.1038/nrm3943 - DOI - PubMed
    1. Proudfoot NJ. Transcriptional termination in mammals: Stopping the RNA polymerase II juggernaut. Science. 2016;352(6291):aad9926 doi: 10.1126/science.aad9926 ; PubMed Central PMCID: PMCPMC5144996. - DOI - PMC - PubMed
    1. Kwong AD, Frenkel N. Herpes simplex virus-infected cells contain a function(s) that destabilizes both host and viral mRNAs. Proc Natl Acad Sci U S A. 1987;84(7):1926–30. Epub 1987/04/01. ; PubMed Central PMCID: PMC304554. - PMC - PubMed
    1. Oroskar AA, Read GS. Control of mRNA stability by the virion host shutoff function of herpes simplex virus. J Virol. 1989;63(5):1897–906. Epub 1989/05/01. ; PubMed Central PMCID: PMC250601. - PMC - PubMed
    1. Sandri-Goldin RM. The many roles of the regulatory protein ICP27 during herpes simplex virus infection. Front Biosci. 2008;13:5241–56. Epub 2008/05/30. doi: https://doi.org/10.2741/3078 [pii]. - DOI - PubMed

Publication types

Grants and funding

This work was funded by the Deutsche Forschungsgemeinschaft (DFG) (grants Do1275/2-1 to LD and FR2938/7-1 to CCF) and the European Research Council (grant ERC-2016-CoG 721016 - HERPES to LD). AWW was the recipient of a generous grant from the Alexander von Humboldt Foundation and the German Federal Foreign Office. The publication costs were funded by the German Research Foundation (DFG) and the University of Wuerzburg in the funding programme Open Access Publishing. The funders had no role in study design, data collection and analysis, decision to publish, or preparation of the manuscript.