. 2018 Mar 22;9(1):1192.
doi: 10.1038/s41467-018-03606-0.

Cryo-EM structure of the polycystic kidney disease-like channel PKD2L1

Affiliations

Cryo-EM structure of the polycystic kidney disease-like channel PKD2L1

Qiang Su et al. Nat Commun. .

Abstract

PKD2L1, also termed TRPP3 from the TRPP subfamily (polycystic TRP channels), is involved in the sour sensation and other pH-dependent processes. PKD2L1 is believed to be a nonselective cation channel that can be regulated by voltage, protons, and calcium. Despite its considerable importance, the molecular mechanisms underlying PKD2L1 regulations are largely unknown. Here, we determine the PKD2L1 atomic structure at 3.38 Å resolution by cryo-electron microscopy, whereby side chains of nearly all residues are assigned. Unlike its ortholog PKD2, the pore helix (PH) and transmembrane segment 6 (S6) of PKD2L1, which are involved in upper and lower-gate opening, adopt an open conformation. Structural comparisons of PKD2L1 with a PKD2-based homologous model indicate that the pore domain dilation is coupled to conformational changes of voltage-sensing domains (VSDs) via a series of π-π interactions, suggesting a potential PKD2L1 gating mechanism.


Conflict of interest statement

The authors declare no competing interests.

Figures
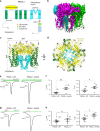
Fig. 1
Fig. 1
Structural characterizations of PKD2L1. a General topology of PKD2L1. PKD2 has a similar topology with a longer N-terminus and no oligomerization domain (OD). b Overall EM map of PKD2L1 (residues 64–629) colored according to different protomers. A swap structure feature can be visualized. Shown from the side view. c, d Overall structure of PKD2L1 (residues 64–629), view from the side and top, respectively. The structure is domain-colored as in panel a. The same color scheme was applied throughout the structural analysis in Figs. 1–6, Supplementary Figs. 5 and 6, and Supplementary Movies 1–3. Glycosyl moieties are shown as sticks. All the above structure figures were prepared using PyMol (The PyMOL Molecular Graphics System, Version 1.8 Schrödinger, LLC.) and the EM map was generated using UCSF Chimera. e, f Ca2+ response ICa was elicited when [Ca2+]o rapidly switched from 0 to 100 mM (green bar). Exemplar traces (e) for PKD2L1_WT (left) or PKD2L1_64–629 (right), both in complex with PKD1L3. Statistical summaries of ICa (f) for the peak amplitude, and the time constant of the decay phase (Td). Number of cells for each group are indicated in the parentheses. PKD2L1_64–629 represents the truncated version of PKD2L1: 64–629, from which the Cryo-EM structure was resolved. g, h Acid response (IpH) was induced when the stimulus of pH 2.5 (red bar) was quickly withdrawn. In all, 2 mM [Ca2+]o was included in the bath solution for IpH throughout this study. Exemplar traces (g) for PKD2L1_WT (left) or PKD2L1_64–629 (right), both in complex with PKD1L3. Statistical summaries of IpH (h) for the peak amplitude, and the time constant of the decay phase (Td). Intracellular buffer of 0.5 mM EGTA was used throughout. All above values are in mean ± SEM, indicated with significance (*p < 0.05; **p < 0.01; and ***p < 0.001). More detailed studies including the negative control can be found in our previous paper
Fig. 2
Fig. 2
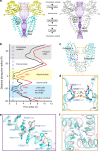
PKD2L1 pore suggests its open conformation in comparison with PKD2 structure. Throughout the analysis, PKD2L1 structures are colored in cyan, green, or yellow according to different domains, and PKD2 or closed-state PKD2L1 model are colored in gray. a The channel passage of PKD2L1 (left) or PKD2 (right, 5T4D) is indicated by purple dots in the center of two diagonal protomers (pore region from chain A and C, polycystin domain from chain B and D) in each channel (with radius smaller than 1.15 Å colored red, between 1.15 and 2.3 Å colored green). The position of selectivity filter is set as the origin of the y-axis. b Pore radii of PKD2L1 (red) and PKD2 (black; 5T4D) along the ion-conducting pathway calculated by HOLE program. c Superimposed examinations between the pore domains of PKD2L1 and PKD2 (only two S5-PH-S6 of diagonal protomers are shown). d Comparison of the selective filter/upper gate between PKD2L1 and PKD2. To emphasize the difference, the two structures of PKD2L1 (cyan) and PKD2 (gray) were superimposed relative to pore helices PH1 and PH2. The constriction site at the upper gate is G522 (PKD2L1) or L641 (PKD2), respectively. Corresponding to PKD2L1 residues, the residue names and numbers in PKD2 are shown in gray immediately after the slash, throughout this study when applicable (In the case of closed-state PKD2L1 model, the respective residue names and numbers in PKD2 are shown in gray within parentheses). e S6 segments of PKD2L1 and PKD2 adopt different conformations. A high-energy π-helix can be witnessed in PKD2 while PKD2L1 only gets a normal α-helix. The absence of this π-helix in PKD2L1 accompanies the C-terminal part of S6 to bend away from the permeation pathway and to shift one residue towards the cytosol. Red arrows emphasize the discrepancies with respect to side chains of marked residues. f Comparison of the lower gate between PKD2L1 and PKD2. Two structures were superimposed similarly as in c. The constriction site at the lower gate is I560 (PKD2L1) or L677 (PKD2), respectively. The counterclockwise red arrows emphasize the comparative differences from PKD2 to PKD2L1
Fig. 3
Fig. 3
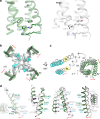
Conformational changes of the VSDs modeled in PKD2L1. a PKD2L1 (green) and PKD2 (gray) both harbor two lysines, K452 and K455 (resp. K572 and K575 in PKD2) in S4, which increases their voltage sensitivity. The two lysines are potentially stabilized by D390 from S3, Y107 from S1, and Y366 from S2 (resp. D511, Y227, and Y487 in PKD2). b Cytosolic view of structural comparison of PKD2L1 (colored as in Fig. 1) and its homologous closed-state model, excluding polycystin domains for the ease of visualization. The whole structure of PKD2L1 displays a clockwise rotation relative to its closed state as viewed from the intracellular side. The red full arrows indicate overall shifts of each protomer from the closed to open state. c One protomer from panel b viewed from the extracellular side; only six transmembrane helices of this protomer are shown. The red dotted arrows indicate the rotation of specific regions. d Dissection of the conformational shifts of the VSD segments relative to the pore domain. The open-state cryo-EM PKD2L1 structure and the closed-state PKD2L1 model are superimposed overall. Adjacent helices are shown in each panel as the reference to indicate the orientation of the structures. The respective residue names and numbers in PKD2 are shown in gray within parentheses throughout this study when applicable (esp. Figs. 3–5)
Fig. 4
Fig. 4
Outward movements of the overall VSD modeled in PKD2L1. a The VSD domain of PKD2L1 (green) has an outward movement compared to that of the homologous PKD2L1 closed-state model (gray; the modeled structure from PKD2 structure 5T4D), as indicated by red full arrows or dotted arrows. b, c The helix-turn formed by the PKD2L1 S3–S4 linker appears to exhibit a small-angle rotation (c) around a cation-π axis (b) by comparing the two PKD2L1 states. Cation–π interactions are formed between R199/Y425 in PKD2L1 and remain stable in both the open-state cryo-EM structure and the closed-state PKD2L1 model (resp. R320/F545 in PKD2). c A cation–π interaction within the S3–S4 linker (R407/W434 in PKD2L1; R528/W554 in PKD2) is disrupted during the small-angle rotation from closed to open conformation. This process may change the orientation of S3 and S4 helices and may further effect the overall arrangement of the VSD and pore domains
Fig. 5
Fig. 5
Interactions between pore domains and neighboring domains modeled in PKD2L1. a The upper gate is persistently close to the polycystin domain in both closed and open states. For visual clarity, only one diagonal protomer is shown. The polycystin domain (yellow represents PKD2L1 and gray for its homologous closed-state model) placed on top is from an adjacent protomer, depicting a close interaction with the pore domain. b The polycystin domain and the pore interact at two pivots, R534/W259 and T501/T130, around which the whole structure of the pore could swing forward and back. c The conformational changes pertaining to the pore regions (S5-PH-S6) between the PKD2L1 structure (cyan) and the homologous model (based on the PKD2 structure) representing its closed state (gray). For visual clarity, only two diagonal protomers are shown. The polycystin domains (yellow in the PKD2L1 structure and gray in the homologous model) placed on top and the S4 helix are from adjacent protomers, ensuring a close interaction with these pore domains, as shown in d. The red dotted arrows indicate regional shifts of the pore domain from a closed to open state. Reciprocal arrows between S4 and S5 are explained as in panel d. d Interactions between the S4 helix and an adjoining S5 helix guarantee that S5 sways together with S4 in the same direction. e Numerous aromatic residues may restrict the dynamics of each pore helix and maintain the related structure as a rigid entity
Fig. 6
Fig. 6
Hypothetical model for PKD2L1 gating mechanisms. Mechanisms of gating for PKD2L1 channels can be described as shown in the schematic. The closed-state of PKD2L1 depicted by the homologous model of PKD2 structure (a) implies the non-conductive state blocked hypothetically by sodium ions (marine dots). PKD2L1 represents the conductive state (b). The polycystin domain remains relatively static (a slightly outward eversion) during the gating process independent of the state. When the channel switches from closed to open in response to voltage or other physiological stimuli, its pore coupled with VSD motions dilates both the lower gate and the upper gate by an iris-like (for S6) and clock-like (for VSD) rotation, respectively

Similar articles

Cited by

References

    1. Nilius B, Flockerzi V. Mammalian transient receptor potential (TRP) cation channels. Preface. Handb. Exp. Pharmacol. 2014;223:v–vi. - PubMed
    1. Torres VE, Harris PC, Pirson Y. Autosomal dominant polycystic kidney disease. Lancet. 2007;369:1287–1301. doi: 10.1016/S0140-6736(07)60601-1. - DOI - PubMed
    1. Li M, et al. Structural basis of dual Ca2+/pH regulation of the endolysosomal TRPML1 channel. Nat. Struct. Mol. Biol. 2017;24:205–213. doi: 10.1038/nsmb.3362. - DOI - PMC - PubMed
    1. Shen PS, et al. The structure of the polycystic kidney disease channel PKD2 in lipid nanodiscs. Cell. 2016;167:763–773. doi: 10.1016/j.cell.2016.09.048. - DOI - PMC - PubMed
    1. Venkatachalam K, Montell C. TRP channels. Annu. Rev. Biochem. 2007;76:387–417. doi: 10.1146/annurev.biochem.75.103004.142819. - DOI - PMC - PubMed

Publication types

MeSH terms