. 2018 Mar 27;2(6):669-680.
doi: 10.1182/bloodadvances.2017012187.

Murine CMV induces type 1 IFN that impairs differentiation of MDSCs critical for transplantation tolerance

Affiliations

Murine CMV induces type 1 IFN that impairs differentiation of MDSCs critical for transplantation tolerance

Anil Dangi et al. Blood Adv. .

Abstract

Clinical tolerance without immunosuppression has now been achieved for organ transplantation, and its scope will likely continue to expand. In this context, a previously understudied and now increasingly relevant area is how microbial infections might affect the efficacy of tolerance. A highly prevalent and clinically relevant posttransplant pathogen is cytomegalovirus (CMV). Its impact on transplantation tolerance and graft outcomes is not well defined. Employing a mouse model of CMV (MCMV) infection and allogeneic pancreatic islet transplantation in which donor-specific tolerance was induced by infusing donor splenocytes rendered apoptotic by treatment with ethylenecarbodiimide, we investigated the effect of CMV infection on transplantation tolerance induction. We found that acute MCMV infection abrogated tolerance induction and that this abrogation correlated with an alteration in the differentiation and function of myeloid-derived suppressor cells (MDSCs). These effects on MDSCs were mediated in part through MCMV induced type 1 interferon (IFN) production. During MCMV infection, the highly immunosuppressive Gr1HI-granulocytic MDSCs were markedly reduced in numbers, and the accumulating Ly6CHI-monocytic cells lost their MDSC-like function but instead acquired an immunostimulatory phenotype to cross-present alloantigens and prime alloreactive CD8 T cells. Consequently, the islet allograft exhibited an altered effector to regulatory T-cell ratio that correlated with the ultimate graft demise. Blocking type 1 IFN signaling during MCMV infection rescued MDSC populations and partially restored transplantation tolerance. Our mechanistic studies now provide a solid foundation for seeking effective therapies for promoting transplantation tolerance in settings of CMV infection.


Conflict of interest statement

Conflict-of-interest disclosure: The authors declare no competing financial interests.

Figures

None
Graphical abstract
Figure 1.
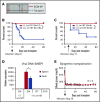
Figure 1.
Acute MCMV (Δm157) infection abrogates tolerance induction by donor ECDI-SPs. (A) Schematic treatment plan of tolerance induction in B6 transplant recipients. Donor (Balb/c) ECDI-SPs (1×10⁸) were infused IV on day −7 and +1. Approximately 200 Balb/c islets were implanted in the kidney capsule of diabetic B6 recipients on day 0. (B) Percent graft survival of islet allografts in uninfected or Δm157-infected recipients, with the infection given on day 0. Data shown in panel B were from at least 5 independent experiments with a total of 10 to 18 mice in each group. (C) Percent graft survival of islet allografts in uninfected or Δm157-infected recipients, with the infection given on day 7. Data shown in panel C were from 2 independent experiments with a total of 5 to 6 mice in each group. (D) Detection of MCMV DNA in the spleen and islet isograft following Δm157 infection. MCMV MEIP gene was quantified by quantitative polymerase chain reaction. Data were normalized to values from tissues of uninfected hosts and presented as mean ± SD (N = 4). (E) Sygeneic transplantation. Percent graft survival of islet isografts in uninfected or Δm157-infected recipients, with the infection given on day 0. *P < .05 (log-rank test). Data presented in panels D and E were compiled from 2 independent experiments with a total of 4 mice in each group.
Figure 2.
Figure 2.
Acute MCMV infection induces type 1 IFN that impairs tolerance induction by donor ECDI-SPs. (A) Kinetics of serum IFN-α level post–MCMV infection (N = 4-6, compiled from 4 independent experiments). (B) Schematic treatment plan and percent graft survival with anti-IFNAR1-Ab blockade. Two cohorts of ECDI-SP–treated transplant recipients were infected with Δm157 on the day of transplantation. The first cohort additionally received anti-IFNAR1 blocking antibody (IP injection; 250 µg/mouse per day) on the indicated days, while the other cohort additionally received isotype antibody on the same indicated days (N = 5-7, compiled from 3 independent experiments). (C) Schematic treatment plan and percent graft survival with recombinant IFN-α treatment. Two cohorts of ECDI-SP–treated transplant recipients were additionally treated with vehicle (PBS) or mouse recombinant IFN-α (400 U/g per day) on the indicated days (N = 6, compiled from 2 independent experiments). *P < .05 (log-rank test).
Figure 3.
Figure 3.
MDSCs are critical for tolerance induction to allogeneic islets by donor ECDI-SPs. (A) Representative FACS plots depicting depletion of both populations of MDSCs (Gr1HI-granulocytic MDSCs and Ly6CHI-monocytic MDSCs) in the blood by the anti-Gr1 antibody. Upper panel: mice treated with isotype control antibody. Lower panel: mice treated with anti-Gr1 antibody. Dot plots were both gated on live CD11b+ cells. Dot plots shown were representative of a total of 4 mice in each group from 2 experiments. (B) Schematic treatment plan and percent graft survival with anti-Gr1 antibody treatment. ECDI-SP–treated transplant recipients further received either anti-Gr1 antibody or isotype control antibody (first dose: 200 µg/mouse; subsequent doses: 100 µg/mouse; IP) on the indicated days (N = 8, data were compiled from 3 independent experiments). *P < .05 (log-rank test).
Figure 4.
Figure 4.
Acute MCMV infection impairs generation of Gr1HI-MDSCs. (A) Kinetics of circulating CD11b+Gr1HI MDSCs in ECDI-SP–treated, either uninfected or Δm157-infected (on day 0), transplant recipients. Total live CD11b+Gr1HI cells were enumerated by FACS in 50 µL of blood drawn on the indicated days. (B) Quantitative analysis of total CD11b+Gr1HI cells in 50 µL of blood collected on day 10 posttransplantation from recipients of the indicated groups. Data shown in panels A and B were from 2 to 3 independent experiments with a total of 4 to 6 mice in each group. *P < .05. (C) Representative histograms of expression of C5aR and FcγRII/III on circulating Gr1HI-MDSCs on day 10 posttransplantation from naïve or transplant recipients with or without day 0 Δm157 infection. (D) Mean fluorescence intensities (MFI) of C5aR and FcγRII/III of groups shown in panel C. Data presented in panels C and D were obtained from 2 independent experiments with a total of 4 mice in each group. (E) In vitro suppression assay using Gr1HI-MDSCs sorted from the spleen of the indicated groups 10 days posttransplantation. Sorted Gr1HI-MDSCs were cocultured with CFSE-labeled syngeneic CD8 T cells stimulated with anti-CD3/CD28 coated beads (at a ratio of 1:1:1). Proliferation of CD8 T cells was measured by CFSE dilution by FACS. (F) Quantification of CD8 T-cell proliferation in the presence of Gr1HI-MDSCs sorted from the indicated groups shown in panel E. Data shown in panels E and F were obtained from 2 independent experiments with a total of 4 mice in each group. Data were presented as mean ± SD. *P < .05. (G) Representative FACS plot depicting the purity of sorted Gr1HI cells pooled from the BM and the spleen of naïve B6 mice used for adoptive transfers. (H) Schematic treatment plan and percent graft survival with adoptive transfer of sorted Gr1HI cells. Two cohorts of ECDI-SP–treated transplant recipients were infected with Δm157 on day 0. The first cohort additionally received ∼30 × 106 sorted Gr1HI cells on the indicated days, while the other cohort did not receive any cells (N = 3-4, compiled from 2 independent experiments). *P < .05 (log-rank test).
Figure 5.
Figure 5.
Acute MCMV infection promotes differentiation of inflammatory Ly6CHImonocytes. (A) Kinetics of circulating CD11b+Ly6CHI cells in ECDI-SP–treated, either uninfected or Δm157-infected (on day 0), transplant recipients. Total live CD11b+Ly6CHI cells were enumerated by FACS in 50 µL of blood drawn on the indicated days. (B) Quantitative analysis of total CD11b+Ly6CHI cells in 50 µL of blood collected on day 10 posttransplantation from recipients of the indicated groups. (C) Representative FACS plots demonstrating the expression pattern of CD115 and CD11c on circulating Ly6CHI cells from the indicated groups on day 10 posttransplantation. Data shown in panels A-C were from 2 to 3 independent experiments with a total of 4 to 6 mice in each group. *P < .05. (D) Representative FACS plot demonstrating graft-infiltrating Ly6CHI cells (gated on total graft-infiltrating live CD11b+ cells; day 10 posttransplant). Scatter graph showing quantitative analysis of the number of graft-infiltrating Ly6CHI cells (N = 6 in each group). (E) Representative FACS plots demonstrating phenotypic expression of CD115 and CD11c on graft-infiltrating Ly6CHI cells shown in panel D. (F) Representative FACS plots demonstrating expression of intracellular IL-12p40, surface CD86, and MHC II from graft-infiltrating Ly6CHI cells shown in panel D. Scatter graphs showing quantitative analysis of MFIs of the indicated markers. Data shown in panels D-F were obtained from 3 independent experiments with a total of 4 to 6 mice in each group. Data were presented as mean ± SD. *P < .05.
Figure 6.
Figure 6.
Functional assessment of Ly6CHIcells and intragraft CD8 T cells and CD4+Foxp3+Tregs. (A) In vitro suppression assay using sorted splenic Ly6CHI cells from the indicated groups 10 days posttransplantation. Control: no Ly6CHI cells were added. Sorted splenic Ly6CHI cells were cocultured with CFSE-labeled syngeneic CD8 T cells stimulated with anti-CD3/CD28 coated beads (at a ratio of 1:1:1). Proliferation of CD8 T cells was quantified by CFSE dilution. Data shown were averaged from a total of 4 mice in each group from 2 independent experiments. (B) Alloantigen cross-presentation by Ly6CHI cells to CD8 T cells. Sorted splenic Ly6CHI cells from the indicated groups were cocultured with CFSE-labeled naïve B6 CD8 T cells at a ratio of 5:1 (Ly6CHI:CD8) in the presence of BALB/c splenocyte lysates (50 µg/mL). CD8 T-cell proliferation was measured by CFSE dilution on day 4 of cocultures. Data shown in panels A and B were averaged from a total of 4 mice in each group from 2 independent experiments and presented as mean ± SD. *P < .05. (C) Quantitative analysis of graft-infiltrating CD3+CD8+ T cells (day 10 posttransplant) from the indicated groups. (D) Representative FACS plots demonstrating graft-infiltrating CD4+Foxp3+ Tregs (day 10 posttransplant; gated on CD3+ cells) from the indicated groups. Scatter graph showing quantitation of Treg numbers. Data shown in panels C and D were from 2 to 3 independent experiments with a total of 4 to 6 grafts in each group. Data were presented as mean ± SD. *P < .05.
Figure 7.
Figure 7.
IFN-α regulates the differentiation of CD11b+Gr1HIand CD11b+Ly6CHIcells from lineage negative (Lin) BM progenitor cells. (A) Representative FACS plots showing preculture LinCD11b cells and their differentiation to CD11b+Gr1HI or CD11b+Ly6CHI cells following a 2-day culture in the presence of vehicle (PBS) or IFN-α (100 U/mL). (B) Bar graphs showing quantitation of Ly6CHI cells (B) or Gr1HI cells (C) following 2 days of culture. (D) Representative histogram showing CD11c expression by Ly6CHI cells differentiated from Lin cells in the presence or absence of IFN-α. (E) Representative FACS plots showing the gating of the remaining CD11bLin cells following the 2-day culture to be examined for intracellular IRF8 expression and representative histogram showing IRF8 expression by CD11bLin cells in the presence or absence of IFN-α. Bar graph showing the MFIs of IRF8 normalized over isotype control. Data shown in panels A-E were obtained from 2 independent culture experiments performed in triplicates and presented as mean ± SD of 6 replicates. *P < .05. (F) Representative histograms depicting the expression of IRF8 in BM hematopoietic stem cells (HSCs: Linc-Kit+Sca-1+) and GMPs (Linc-Kit+Sca-1FcγRII/III+) from naïve mice (solid purple line), uninfected ECDI-SP–treated mice (solid green line), or Δm157-infected ECDI-SP–treated mice (dashed blue line) 2 days post–Δm157 infection. Data shown in panel F were obtained from 2 independent experiments with a total of 4 mice in each group.

Similar articles

Cited by

References

    1. Forbes BA. Acquisition of cytomegalovirus infection: an update. Clin Microbiol Rev. 1989;2(2):204-216. - PMC - PubMed
    1. Fishman JA, Emery V, Freeman R, et al. . Cytomegalovirus in transplantation—challenging the status quo. Clin Transplant. 2007;21(2):149-158. - PubMed
    1. Eid AJ, Razonable RR. New developments in the management of cytomegalovirus infection after solid organ transplantation. Drugs. 2010;70(8):965-981. - PubMed
    1. Stern M, Hirsch H, Cusini A, et al. ; Members of Swiss Transplant Cohort Study. Cytomegalovirus serology and replication remain associated with solid organ graft rejection and graft loss in the era of prophylactic treatment. Transplantation. 2014;98(9):1013-1018. - PubMed
    1. Azevedo LS, Pierrotti LC, Abdala E, et al. . Cytomegalovirus infection in transplant recipients. Clinics (São Paulo). 2015;70(7):515-523. - PMC - PubMed

Publication types

MeSH terms