. 2018 Mar 29;555(7698):623-628.
doi: 10.1038/nature25979. Epub 2018 Mar 19.

Extensive impact of non-antibiotic drugs on human gut bacteria

Affiliations

Extensive impact of non-antibiotic drugs on human gut bacteria

Lisa Maier et al. Nature. .

Abstract

A few commonly used non-antibiotic drugs have recently been associated with changes in gut microbiome composition, but the extent of this phenomenon is unknown. Here, we screened more than 1,000 marketed drugs against 40 representative gut bacterial strains, and found that 24% of the drugs with human targets, including members of all therapeutic classes, inhibited the growth of at least one strain in vitro. Particular classes, such as the chemically diverse antipsychotics, were overrepresented in this group. The effects of human-targeted drugs on gut bacteria are reflected on their antibiotic-like side effects in humans and are concordant with existing human cohort studies. Susceptibility to antibiotics and human-targeted drugs correlates across bacterial species, suggesting common resistance mechanisms, which we verified for some drugs. The potential risk of non-antibiotics promoting antibiotic resistance warrants further exploration. Our results provide a resource for future research on drug-microbiome interactions, opening new paths for side effect control and drug repurposing, and broadening our view of antibiotic resistance.


Conflict of interest statement

Author Information

The authors declare no competing financial interests.

Figures
Extended Data Figure 1
Extended Data Figure 1. Screen set-up and species selection.
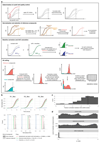
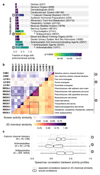
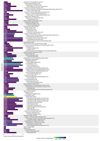
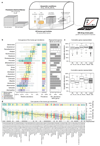
a. Drugs from the Prestwick Chemical Library (arranged in either 96- or 384-well format) were diluted in growth media (for most part mGAM) and pre-reduced in a Coy anaerobic chamber before inoculation with one out of 40 different human gut microbes. Bacterial growth was monitored for 16-24 hour at 37°C. Growth curves were acquired at least in triplicates for each drug-microbe interaction (see also Methods). b. Species with a minimum relative abundance of 1% in at least one sample and a prevalence of 50% across samples (the latter estimated by rarefying to 10,000 reads mapping to taxonomic markers) were included in the set of core species. Boxplots show relative abundances of core species grouped by genus (according to NCBI taxonomy) and colored by phylum (see key). The inner box indicates the inter-quartile range (IQR), with the median as black vertical line; the outer bars extend to the 5th and 95th percentiles; circles, outliers. To the right of the boxplots, prevalence is depicted by bars, and next to this the species diversity is shown: grey boxes indicate species represented in the screen with box widths corresponding to mean relative abundance within the genus. c. Relative abundance of genera of which at least one species was represented in the screen cumulates to 78% of the assignable fraction of reads (median across all samples, upper panel); first four boxplots show abundance within each study identified by country codes underneath –. When directly cumulating the relative abundance of represented species the corresponding median is 60% (lower panel). Boxes span the IQR and whiskers extend to the most extreme data points up to a max of 1.5 times the IQR. d. Core species are shown in the order of their median abundances across all samples. Relative abundance boxplots and prevalence bars are defined as in (b) and grey boxes underneath indicate species screened in this study. Numbers in brackets correspond to specI cluster identifiers (version 1) .
Extended Data Figure 2
Extended Data Figure 2. Data analysis pipeline for identifying compounds with anticommensal activity.
a. Schematic overview of the data analysis pipeline. All steps (determination of time cutoff and removal of noisy points; normalization and selection of reference compounds, baseline correction, AUC calculation and hit calling) are explained in detail in methods. On first panel dashed lines on plot on the right depict the three possible effects that a drug can have on the growth of a microbe: increase the lag phase, decrease the growth rate or the stationary phase plateau. All effects are captured by cutting off the growth curves upon transition to stationary phase for most compounds (most drugs do not affect growth). On second panel, median growth rates for two drugs on same plate are depicted and normalized, whereas baseline correction (third panel) is applied at the individual wells. b. Growth curves (normalized OD) of Bacteroides ovatus in three exemplary drug cases for the three biological replicates (upper panel) - meclofenamic acid (red), moricizine (green) and diacerein (blue). Light and dark grey shades represent the 50% and 90% confidence intervals for normal growth. Normalized AUC histograms for all drugs in the three biological replicates for the case of B. ovatus. Meclofenamic acid is just below the hit threshold, moricizine is a hit with partial but strong growth inhibition, and diacerein almost completely inhibits the growth of B. ovatus. c. For most species, correlation between replicates is very high (median: 0.88). d. For both controls and reference compounds, p-values were approximately uniformly distributed. Determining the background distribution of uninhibited growth using reference compounds is validated by their very similar behavior with control wells. Other drugs (i.e. drugs not used as reference compounds) show a clear enrichment of low p-values.
Extended Data Figure 3
Extended Data Figure 3. Anticommensal activity relative to compound- and compartment-specific drug concentrations.
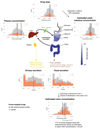
Simplified pharmacokinetic estimation of small intestine and colon concentrations by assuming that one dose of an orally administered drug (extracted from Drugs@FDA and Daily Defined Dose (DDD) of the ATC) reaches the intestine and is dissolved/absorbed similarly as the well-absorbed drug, posaconazole (see also Supplementary Table 1). After absorption into the liver via the portal circulation, the drug enters circulation through the hepatic veins and reaches its characteristic plasma concentration. The two main routes of drug elimination are either secretion via kidney/urine or secretion into the intestine via the biliary duct. In the intestine, drugs can be reabsorbed in a circuit called the enterohepatic cycle or excreted in stools. Compounds that are either poorly absorbed in the small intestine or secreted by bile reach the large intestine. Considering the measured excreted fraction of the drug in feces (both changed and unchanged compound, as we do not know whether drug is metabolized in liver or gut), and assuming a large intestinal transit time of 24 h and a volume of distribution in the colon of 0.6 liters , we estimated the colon concentrations of the human-targeted drugs in our screen (see also Supplementary Table 1). Histograms for drug dose, plasma concentrations, estimated small intestine concentration, urinary and fecal excretion and estimated colon concentrations depict the respective distributions for human-targeted drugs color-coded based on their anticommensal behavior in our screen. Dashed lines indicate medians, vertical lines highlight the drug concentration used in our screen (20 μM). Interactions between drugs and microbiota are possible throughout the entire gastrointestinal tract with microbial load having a gradient-like distribution (ileum and colon containing the largest numbers), which can be though disturbed during disease . Also drugs can be modified at several stages: by host digestive and intestinal epithelial enzymes, by phase I and phase II metabolism in the liver and by microbial enzymes. Some of these processes neutralize each other, resulting in reconversion into the original compound.
Extended Data Figure 4
Extended Data Figure 4. Effects of metformin in gut microbiota in vivo correlate with its in vitro activity.
a. IC25’s of the antidiabetic drug metformin for a selection of 22 strains. Metformin did not inhibit any species in our screen as the concentration used, 20 μM (red line), is below the IC25 of all strains. However, at its estimated small intestinal and colon concentration of 1.5 mM (blue line), metformin would inhibit 3/22 tested strains. This exemplifies that more human-targeted drugs would interfere with bacterial growth if doses were to be increased towards drug- and body-site-specific concentrations. b. IC25’s of metformin correlate well with its observed effects in humans , based on the four species that overlap between the two studies. Significant treatment effects on the species level were mapped to our set of strains for which we had determined IC25’s.
Extended Data Figure 5
Extended Data Figure 5. Validation of the screen and conservative hit-calling.
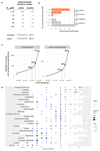
a-b. Validation of our screen by IC25 determination for 25 selected drugs in a subset of up to 27 strains reveals high precision (94%) and recall (85%). We considered IC25 as the lowest concentration that reduces growth by >25% (Methods). Breakdown into active and inactive compounds for drugs concentrations at the 20 μM concentration, used in our screen. True positives (TP) – green; false positive (FP) – red; true negatives (TN) – grey; false negative (FN) - blue. c. Number of drugs with anticommensal activity versus the applied FDR threshold for all compounds (left) and human-targeted drugs (right). Increasing the FDR threshold from 0.01 to 0.1 (vertical grey lines) would nearly double the fraction of drugs impacting human gut microbes. d. IC25’s of 25 drugs in up to 27 individual strains (see also panels a-b.). The white area indicates the drug concentration ranges tested for each drug. Symbol sizes depict number of strains with a particular IC25, symbol colors indicate categorization into FN, FP, TN or TP, and symbol shapes qualify whether actual IC25s were determined or IC25 was deemed to be higher or lower from the highest and lowest concentration tested, respectively. Vertical line indicates the drug concentration used in screen (20 μM). IC25’s for all drug-strain pairs are listed in Supplementary Table 4. Particular drugs were responsible for FNs in our screen (acarbose, loperamide, thioridazine), presumably due to drug decay.
Extended Data Figure 6
Extended Data Figure 6. IC25 relation to drug concentrations in human body.
For drug-strain pairs with measured IC25’s (Supplementary Fig. 5), we compared IC25’s with plasma and estimated small intestine and colon concentrations by plotting the number of strains that are affected in relation to whether they are above/below relevant body concentrations (color code). With the exception of estradiol valerate and 5-FU (only plasma concentrations available), all other drugs with available body concentrations reach concentrations high enough in the body to reach IC25’s for at least one gut microbial species (out of up to 27 tested for IC25’s).
Extended Data Figure 7
Extended Data Figure 7. Concordance of drug in vitro species susceptibilities and drug-mediated shifts in microbiome composition of patients.
a. Association coefficients between PPI usage and relative taxonomical abundance in fecal microbiomes of PPI users from two studies (twins, UK cohort – green ; and 3 independent cohorts from the Netherlands - blue) (left) are compared to in vitro growth inhibition of isolates with same taxonomic rank in the presence of PPIs (omeprazole, lansoprazole and rabeprazole) as accessed by FDR adjusted p-values (q-values) in our screen (right). Point size in the left panel corresponds to the q-value as reported in the original study. Reduced taxa in patients (negative association coefficient, left to vertical black line) were mostly inhibited by PPIs in our screen (q-value below 0.01, left to vertical black line), while enriched taxa were insensitive to PPIs. Box plots show: centre line, median; box limits, upper and lower quartiles; whiskers, 1.5x interquartile range; points, outliers. For fewer than 10 data points, all points are shown individually. b. Spearman correlation coefficients between association coefficients of fecal microbiome composition after consumption of amoxicillin or azathioprine and the screen p-values. The histogram represents the background distribution of correlations between the in vitro data for all human-targeted drugs and the in vivo response to these drugs; correlations with amoxicillin/azathioprine are highlighted by triangles c. Comparisons between association coefficients and drugs from different therapeutic classes as assessed by Falony et al. and our in vitro data. d. A bipolar disease cohort study reported a significantly decrease in abundance of Akkermansia upon atypical antipsychotics (AAP) treatment. Comparing distributions of adjusted p-values from our screen for different strains, Akkermansia muciniphila was significantly more sensitive than all other strains to antipsychotics in general and APP in particular (p = 0.02 and p = 0.09, one-sided Wilcoxon rank sum test). In contrast, A. muciniphila is relatively more resistant than other strains across all human-targeted drugs (p = 0.0005, one-sided Wilcoxon rank sum test). Violin plot shows estimated density of points with the estimated median as vertical bar. For fewer than 10 data points, all points are also shown individually.
Extended Data Figure 8
Extended Data Figure 8. Evaluation of anticommensal activity predictions based on side-effects.
a. IC25’s of 26 candidate compounds (p-value for enrichment of antibiotic-related side effects < 1e-4, using a one-sided Fisher’s exact test) and 16 control compounds (see also Fig. 3d & panel d of this Figure) were determined for 18 representative strains and results are depicted as an IC25 heatmap. Drugs are ordered according to their side effect similarity to antibiotics from left to right (for antibiotic-related side effects see Supplementary Table 5). Qualifiers indicate whether IC25s are higher/lower than the indicated concentration; if no symbol the box depicts the exact IC25. If highest tested concentrations did not reduce growth of any of the tested strains, the compound was classified as inactive (e.g. Topiramate). b. Dose of the tested compounds according to the Defined Daily Dose and Drugs@FDA databases (see also Supplementary Table 1). c. Based on a compound’s recommended dose and its median IC25 for different bacterial strains, we estimated the number of doses need to reach this IC25. This number was plotted against the drug’s p-value for enrichment of antibiotics-related side effect. For direct comparison between the two groups, see Fig. 3e. Circles in magenta depict drug–strain pairs for which growth was reduced, showing a clear correlation between p-values and the estimated number of doses (magenta line). To rule out that the tested concentration range is causing this correlation, we also depict the estimated number of doses corresponding to the highest tested concentration (grey line), which exhibits no clear dependency between p-value and number of doses. A vertical line across all panels connects all parameters attributable to a particular drug. d. Recommended single drug doses of human-targeted drugs with no anticommensal activity in our screen plotted against enrichment in antibiotic-related side effects (n=339). Candidate and control drugs selection for testing for anticommensal activity at higher concentrations were selected based on similarity to antibiotic-related side effects (vertical black line depicts prediction threshold) and aiming at drugs used at higher doses than concentration in our screen (horizontal dashed line). Purple and dark grey triangles indicate hits and non-hits from this validation effort, respectively. e. Ratios between IC25 and estimated colon concentrations are significantly lower (p = 0.017, two-sided Wilcoxon rank sum test) for candidate drugs than for control drugs. For candidate drugs, 16/52 (31%) IC25’s were below the estimated colon concentrations while for control drugs this fraction was only 5/50 (10%). Box plots show: centre line, median; box limits, upper and lower quartiles; whiskers, 1.5x interquartile range; points, outliers.
Extended Data Figure 9
Extended Data Figure 9. Drug therapeutic classes with anticommensal activity.
a. Fraction of drugs with anticommensal activity by ATC indication area (bars). All first-level indication areas and significantly enriched lower levels are shown (see also ED Fig. 10). Significance (p-value, one-sided Fischer’s exact test) is controlled for multiple hypothesis testing (Benjamini-Hochberg) independently at each ATC hierarchy level. b. Heat map of anticommensal activity and chemical similarities of human-targeted drugs within the three significantly ATC indication levels from a. Colors represent the median of drug pairwise Spearman correlations within and between subgroups depicted, calculated from the growth profiles of the 40 strains in each drug (p-values) or their Tanimoto scores . Examples of structurally similar (phenothiazines; N05AA-AC) and diverse (N05AF-AX) antipsychotics that all elicit similar responses in our screen are marked. c. Antipsychotics exhibit higher similarity in gut microbes they target than that expected based on their structural similarity (p-value = 2e-19 estimated from random permutations; other classes depicted show no significance difference). Box plots show: centre line, median; box limits, upper and lower quartiles; whiskers, 1.5x interquartile range; points, outliers. Notches correspond roughly to a 95% confidence interval for comparing medians.
Extended Data Figure 10
Extended Data Figure 10. Drugs with anticommensal activity for all hierarchy levels of the ATC classification system.
Fraction of drugs with anticommensal activity for all indication areas of the ATC classification scheme with a high fraction of active compounds. Shown are indication areas that contain at least two active compounds and a fraction of at least 50% active compounds, their parent terms and all top-level indication areas. Significance (p-value, one-sided Fischer’s exact test) is indicated by the bar color and corrected for multiple hypothesis testing (Benjamini-Hochberg) independently at each hierarchy level of the ATC. Many smaller classes, including PPIs (A02BC), non-selective calcium channel blockers (C08E), synthetic estrogens (G03CB), leukotriene receptor antagonists (R03DC) and phenothiazine and other antihistamines (R06AD & R06AX) are enriched, but due to multiple testing and small numbers of drugs tested in each group, they do not reach a significant p-value.
Extended Data Figure 11
Extended Data Figure 11. Comparing chemical similarity of drugs and similarity of hit profiles across gut microbes.
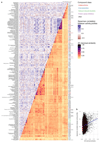
a. Heat map of anticommensal activity and chemical similarities for all active human-targeted drugs in our screen. Drugs are clustered according to chemical similarity. Colors represent the median of drug pairwise Spearman correlations within and between subgroups depicted, calculated from the growth profiles of the 40 strains in each drug (p-values) or their Tanimoto scores . Several prominent groups are color coded. Only drugs of some classes share both chemical similarity and have similar effects on the 40 strains – for example: phenothiazine antipsychotics & antihistamines (N05A & R06AD), structurally similar dibenzothiazepines & dibenzoxazepines for antipsychotics and antidepressants (N05AH & N06AA), PPIs (A02BC), antiestrogens (L02BA), synthetic estrogens (G03CB) and anti-inflammatory fenamates (M01AG & M02AA06). b. A mild correlation exists between chemical similarity (Tanimoto scores) and anticommensal activity similarity (drug pairwise Spearman correlations) - rs = 0.12 (p-value of Spearman’s test < 2e-16).
Extended Data Figure 12
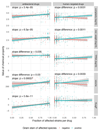
Extended Data Figure 12. More complex, bulkier and heavier human-targeted drugs are more effective against Gram-positive bacteria.
Fraction of inhibited Gram-positive (blue, N = 22) or -negative (red, N = 18) strains per drug plotted against different chemical properties of the drugs. Chemical properties, such as complexity (based on atom types, symmetry, computed using the Bertz/Hendrickson/Ihlenfeldt formula), molecular weight, TPSA (topological polar surface area, an estimate of the area - in Å squared), volume (in cubic Å) and XLogP (distribution coefficient that is a measure of differential solubility in octanol/water) were obtained from PubChem . For each chemical property, we used a Type II ANOVA to test for linear dependency between the fraction of affected species and the chemical property (slope). Additionally, we tested if this dependency depended on the Gram stain (slope difference). It is possible that there is no significant slope without considering Gram stain, but that there is a significant difference between the slopes for the two Gram stains. Lines show a linear fit to the data, with 95% confidence intervals as shaded area.
Figure 1
Figure 1. Systematic profiling of marketed drugs on a representative panel of human gut microbial species.
a. Broad impact of pharmaceuticals on the human gut microbiota. Compounds of the Prestwick Chemical Library are divided into drugs used in humans, exclusively in animals (veterinary) and compounds without medical/veterinary use (non-drugs). Human-use drugs are further categorized according to targeted organism. Strain-drug pairs (i.e. instances when a drug significantly reduced the growth of a specific strain; Methods) are highlighted with a vertical colored bar in the matrix. Bacterial strains are sorted by drug sensitivity. Relative abundances of each strain in four cohort studies of healthy individuals are displayed on the right (boxes correspond to IQR and central line to median relative abundance). b. Fraction of drugs with anticommensal activity by sub-category. Grey scale within bars denotes inhibition spectrum, that is the number of affected strains per drug. c. Correlation between species abundance in the human microbiome and their drug sensitivity. For each strain (N=40), the number of drugs impacting its growth is plotted against its median relative abundance in the human gut microbiome. Lines depict the best linear fit, rS the Spearman correlation and grey shade the 95% confidence interval of the linear fit. All drugs, and in particular human-targeted drugs inhibit the growth of abundant species more.
Figure 2
Figure 2. Evaluating human-targeted drugs with anticommensal activity.
a. Estimated small intestine and colon concentrations, and measured plasma concentrations for human-targeted drugs with (orange) and without (grey) anticommensal activity in our screen (Methods, ED Fig. 2). For both active and inactive compounds, the median estimated small intestine and colon concentrations are higher than the screened concentration (20 μM, black vertical lines), whereas plasma concentrations are lower. Non-hits in our screen generally reach higher plasma and small intestine concentrations (two-sided Wilcoxon rank sum test). Box plots: center line, median; limits, upper and lower quartiles; whiskers, 1.5x IQR; points, outliers. b. Rarefaction analysis indicates that anticommensal activity would be discovered for more human-targeted drugs if we screened additional strains.
Figure 3
Figure 3. Anticommensal activity of human-targeted drugs in vitro reflects patient data.
a. Changes in microbiome composition of patients taking PPIs are in agreement with drug effects in our screen. Displayed are Spearman correlation coefficients between in vitro growth inhibition p-values and changes in taxonomic relative abundances after PPI consumption for corresponding taxa from two studies (Twins UK and Dutch cohorts, 229/1827 and 211/1815 individuals had taken PPIs respectively). The histogram represents the background distribution of correlations between the in vitro data for all human-targeted drugs and the in vivo response to PPIs; correlations with PPIs are highlighted by triangles. b. Human-targeted drugs with anticommensal activity in our screen had a significantly higher incidence of antibiotic-related side effects (orange trace shows cumulative distribution, N = 285 drug-side effect pairs) in clinical trials compared to drugs without activity (grey trace, N = 767; p = 0.002, two-sided Wilcoxon rank sum test). Dashed lines indicate the incidence of the same side effects upon placebo treatment, with no significant difference between active (N = 138) and inactive drugs (N = 474). c. Based on similarity to antibiotic-related side effects, we selected 26 candidate and 16 control drugs for testing for anticommensal activity. Although both candidate and control drugs inhibited bacterial growth at higher concentrations, candidate drugs had anticommensal activity at significantly lower doses than control drugs (p = 5.6e-7, two-sided Wilcoxon rank sum test). Box plots as in Fig. 2a.
Figure 4
Figure 4. Antibiotic resistance mechanisms protect against human-targeted drugs.
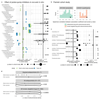
a. Susceptibility to antibacterials and human-targeted drugs correlates across the 40 tested strains (Spearman correlation, rS=0.6 and a line depicting the nonlinear least-squares estimate of the odds ratio, OR=0.06), suggesting common resistance mechanisms against both drug types. Knocking out a major antibiotic efflux pump, tolC, in the lab E. coli strain, BW25113 (behaving as the other 2 commensal E. coli strains in the screen), makes E. coli equally more sensitive to both antibacterials and human-targeted drugs. Two antibiotic-resistant isolates of B. fragilis (black square, HM-20) and B. uniformis (black diamond, HM-715) were screened in addition to the main screen with only the latter showing a similar increase in resistance towards human-targeted drugs. b. Chemical genetic screen of an E. coli genome-wide overexpression library in 7 non-antibiotics; all screens except for metformin were performed in ΔtolC background to sensitize E. coli to these drugs. Genes that when overexpressed improved significantly the growth of E. coli to at least one of the drugs are shown here; in bold genes previously associated with antibiotic resistance. Among them, genes encoding for transporters from different families: DMT (drug metabolite transporter), MFS (major facilitator superfamily), MATE (multidrug and toxin extrusion), SMR (small multidrug resistance) and ABC (ATP-binding cassette). Growth is measured by colony size (median n=4) , color depicts the normalized size difference from the median growth of all strains in the drug (>6-fold difference), and dot size the significance (FDR-corrected p-value <0.1). Control denotes the growth of the library without drug.

Comment in

Similar articles

Cited by

References

    1. Kåhrström CT, Pariente N, Weiss U. Intestinal microbiota in health and disease. Nature. 2016;535:47. doi: 10.1038/535047a. - DOI - PubMed
    1. Forslund K, et al. Disentangling type 2 diabetes and metformin treatment signatures in the human gut microbiota. Nature. 2015;528:262–266. doi: 10.1038/nature15766. - DOI - PMC - PubMed
    1. Imhann F, et al. Proton pump inhibitors affect the gut microbiome. Gut. 2016;65:740–748. doi: 10.1136/gutjnl-2015-310376. - DOI - PMC - PubMed
    1. Jackson MA, et al. Proton pump inhibitors alter the composition of the gut microbiota. Gut. 2016;65:749–756. doi: 10.1136/gutjnl-2015-310861. - DOI - PMC - PubMed
    1. Rogers MA, Aronoff DM. The influence of non-steroidal anti-inflammatory drugs on the gut microbiome. Clin Microbiol Infect. 2016;22:178 e171–179. doi: 10.1016/j.cmi.2015.10.003. - DOI - PMC - PubMed

Publication types

MeSH terms