. 2018 Jun;37(23):3166-3182.
doi: 10.1038/s41388-018-0209-0. Epub 2018 Mar 16.

Collagen abundance controls melanoma phenotypes through lineage-specific microenvironment sensing

Affiliations

Collagen abundance controls melanoma phenotypes through lineage-specific microenvironment sensing

Zsofia Miskolczi et al. Oncogene. 2018 Jun.

Abstract

Despite the general focus on an invasive and de-differentiated phenotype as main driver of cancer metastasis, in melanoma patients many metastatic lesions display a high degree of pigmentation, indicative for a differentiated phenotype. Indeed, studies in mice and fish show that melanoma cells switch to a differentiated phenotype at secondary sites, possibly because in melanoma differentiation is closely linked to proliferation through the lineage-specific transcriptional master regulator MITF. Importantly, while a lot of effort has gone into identifying factors that induce the de-differentiated/invasive phenotype, it is not well understood how the switch to the differentiated/proliferative phenotype is controlled. We identify collagen as a contributor to this switch. We demonstrate that collagen stiffness induces melanoma differentiation through a YAP/PAX3/MITF axis and show that in melanoma patients increased collagen abundance correlates with nuclear YAP localization. However, the interrogation of large patient datasets revealed that in the context of the tumour microenvironment, YAP function is more complex. In the absence of fibroblasts, YAP/PAX3-mediated transcription prevails, but in the presence of fibroblasts tumour growth factor-β suppresses YAP/PAX3-mediated MITF expression and induces YAP/TEAD/SMAD-driven transcription and a de-differentiated phenotype. Intriguingly, while high collagen expression is correlated with poorer patient survival, the worst prognosis is seen in patients with high collagen expression, who also express MITF target genes such as the differentiation markers TRPM1, TYR and TYRP1, as well as CDK4. In summary, we reveal a distinct lineage-specific route of YAP signalling that contributes to the regulation of melanoma pigmentation and uncovers a set of potential biomarkers predictive for poor survival.


Conflict of interest statement

The authors declare that they have no conflict of interest.

Figures
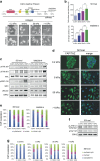
Fig. 1
Fig. 1
Mechanosignalling regulates melanoma cell adhesion and nuclear YAP/TAZ localization. a Morphology of 501mel and WM266-4 cells cultured for 72 h on collagen with the indicated stiffness degrees. A scale for matrix elasticity of tissues is shown varying from soft brain to rigid bone (adapted from [18]). Scale bar represents 20 µm. b Quantification of cell morphology of 501mel and WM266-4 cells cultured for 72 h on collagen with the indicated stiffness degrees (n = 3 experiments; n = 100 cells). Graphs show mean ± SEM. Tukey’s post-test following one-way ANOVA. *p < 0.05, **p < 0.01, ***p < 0.001. c Western blot analysis of pFAK, pSRC and pMLC2 of 501mel and WM266-4 cells cultured on collagen with the indicated stiffness degrees for 72 h. Total SRC, FAK and ERK2 was used as a loading control.d Immunofluorescence analysis of YAP/TAZ localization in 501mel cells cultured on collagen with the indicated stiffness degrees for 72 h. Scale bar represents 50 µm. e Quantification of YAP/TAZ localization in 501mel and WM266-4 cells cultured on collagen with the indicated stiffness degrees for 72 h (n = 3 experiments; n = 100 cells). f Western blot for LATS and YAP phosphorylation in 501mel cells cultured on collagen with the indicated stiffness degrees for 72 h. g Quantification of YAP/TAZ localization in 501mel cells cultured on collagen with the indicated stiffness degrees treated with 1 μM AZD0530 (SRCi), 1 μM PF562271 (FAKi) or DMSO for 24 h (n = 3 experiments; n = 100 cells)
Fig. 2
Fig. 2
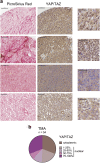
Increased collagen deposition correlates with nuclear YAP/TAZ localization. a Immunohistochemistry of a tissue microarray of primary and metastatic melanocytic lesions stained with PicroSirius Red (for collagen) and a YAP/TAZ-specific antibody. Scale bars represent 100 μm, and 50 µm for the magnifications. b Quantification of YAP/TAZ localization in the nucleus/cytoplasm of tissue microarray of primary and metastatic melanocytic lesions (n = 54)
Fig. 3
Fig. 3
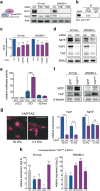
YAP regulates MITF expression in melanoma. a Western blot analysis of MITF and PAX3 of 501mel and WM266-4 cells treated with PAX3-specific siRNAs (#1 and #2) for 48 h. ERK2 served as a loading control. A model indicating the PAX3-YAP interaction at the MITF promoter is shown. b Co-Immunoprecipitation of YAP and PAX3 using an anti-PAX3 antibody for precipitation and an anti-YAP antibody for Western blot analysis of the precipitate. c qRT-PCR analysis of MITF expression in 501mel and WM266-4 cells upon treatment with three YAP-specific siRNAs (ON-TARGETplus SMARTpool, #6 and #7) for 48 h. Graphs show mean ± SEM. Tukey’s post-test following one-way ANOVA. n.s., not significant, *p < 0.05, **p < 0.01. d Western blot analysis of MITF and YAP/TAZ in 501mel and WM266-4 cells upon YAP siRNA (SMARTpool) treatment for 48 h. ERK2 served as a loading control. e Luciferase reporter assay for transcriptional activity driven from the indicated MITF promoter fragments in the presence of over expressed GFP or YAP5SA in 501mel cells. f Western blot analysis of MITF and YAP of 501mel and WM266-4 cells upon overexpression of YAP5SA. β-tubulin served as a loading control. g Immunofluorescence analysis of YAP/TAZ of 501mel cells and qRT-PCR analysis of MITF and YAP expression in 501mel cells upon YAP siRNA (ON-TARGETplus SMARTpool) treatment cultured on 50 and 0.2 kPa collagen gels. Graphs show mean ± SEM. Tukey’s post-test following one-way ANOVA. n.s., not significant, **p < 0.01, ***p < 0.001. Scale bar represents 50 µm. h qRT-PCR analysis for the expression of YAP, MITF and the MITF target genes TRPM1, PMEL and TYR in 501mel and WM266-4 cells cultured on a 0.2 kPa collagen gel upon overexpression of YAP5SA. Graphs show mean ± SEM. Tukey’s post-test following one-way ANOVA. n.s., not significant, *p < 0.05, **p < 0.01
Fig. 4
Fig. 4
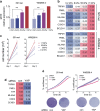
Increased collagen stiffness promotes proliferation and differentiation via YAP1/MITF. a qRT-PCR analysis of MITF expression in 501mel and WM266-4 cells cultured on collagen with the indicated stiffness degrees for 7 days. Graphs show mean ± SEM. Tukey’s post-test following one-way ANOVA. **p < 0.01. b Heatmap of relative expression of differentiation (TRPM1, PMEL, TYR and MLANA), proliferation (CDK2 and CCND1) and survival (BCL2A1) genes in 501mel and WM266-4 cells cultured on collagen with the indicated stiffness degrees for 7 days. c Quantification of proliferation of 501mel and WM266-4 cells cultured on collagen with the indicated stiffness degrees for 72 h. d Heatmap of relative expression of differentiation (TRPM1, PMEL, TYR and MLANA) and proliferation genes (CDK2 and CCND1) in 501mel cells upon YAP siRNA (ON-TARGETplus SMARTpool) treatment. e Incucyte analysis and crystal violet staining to measure cell growth (confluency) of 501mel and WM266-4 cells upon YAP siRNA (SMARTpool) treatment
Fig. 5
Fig. 5
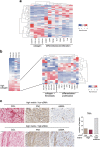
Fibroblast infiltration inversely correlates with a proliferation/differentiation state. a Hierarchical clustering of gene expression data from a cohort of 57 stage IV melanomas using the Jonsson dataset (GEO number: GSE22153 and see [27]). b Hierarchical clustering of gene expression data in a ‘high collagen’ expression cohort using the Jonsson dataset (GEO number: GSE22153). Patients with high expression of collagen type I were selected and re-analysed including fibroblasts markers ACTA2 and PDGFRB (indicated by *). c Immunohistochemistry of a tissue microarray of primary and metastatic melanocytic lesions stained with PicroSirius Red (for collagen), fibronectin (FN1) and αSMA (ACTA2, fibroblast marker) antibodies and quantification of matrix (FN1 + COL) and αSMA staining intensity. Scale bars represent 100 μm
Fig. 6
Fig. 6
Melanoma cells stimulate fibroblast-mediated matrix deposition and remodelling. a Quantification of fibroblast proliferation using Edu incorporation after co-culture with the indicated melanoma cell lines for 7 days. Graphs show mean ± SEM. Tukey’s post-test following one-way ANOVA. **p < 0.01. b Quantification of fibroblast proliferation using Edu incorporation after treatment with conditioned media from a panel of melanoma cell lines for 7 days. Graphs show mean ± SEM. Tukey’s post-test following one-way ANOVA. **p < 0.01. c qRT-PCR analysis of expression of matrix genes (FN1, COL1A1 and COL1A2) and matrix remodelling genes (MMP1, MMP2 and TIMP1) in fibroblasts treated with WM266-4 conditioned medium (mel-CM) for 7 days. Graphs show mean ± SEM. Tukey’s post-test following one-way ANOVA. **p < 0.01, ***p < 0.001. d Immunofluorescence analysis of cell-derived matrix from fibroblasts treated with WM266-4 conditioned medium, using collagen-specific (COL1) and fibronectin-specific (FN1) antibodies. Scale bar represents 100 µm. e Pore size analysis of cell-derived matrix from fibroblasts treated with WM266-4 CM or co-cultured with WM266-4 cells. Images generated by immunofluorescence (example shown) were binary transferred and pore size was measured by using BoneJ plugin Thickness/Space function. Quantification of mean pore size of images is shown (n = 3 experiments; n = 10 images). f Gel contraction assay of fibroblasts embedded in collagen gel and treated with conditioned media from 501mel and WM266-4 cells or with 20 ng/ml TGFβ as a positive control. The perimeter of the collagen gel was measured after 72 h. Graphs show mean ± SEM. Tukey’s post-test following one-way ANOVA. **p < 0.01. g qRT-PCR analysis of MITF, TRPM1 and PMEL expression in WM266-4 cells co-cultured with fibroblast for 7 days. Graphs show mean ± SEM. Tukey’s post-test following one-way ANOVA. **p < 0.01, ***p < 0.001. h qRT-PCR analysis of MITF, TRPM1 and PMEL expression in WM266-4 cells treated with fibroblast conditioned medium (fibroblast-CM) for 7 days. Graphs show mean ± SEM. Tukey’s post-test following one-way ANOVA. **p < 0.01, ***p < 0.001
Fig. 7
Fig. 7
Differential YAP-meditated transcription is influenced by fibroblast infiltration and impacts on patient survival. a qRT-PCR analysis of expression of TGFβ in fibroblasts treated with WM266-4, 501mel or A375 conditioned media for 7 days. Graphs show mean ± SEM. Tukey’s post-test following one-way ANOVA. *p < 0.05, **p < 0.01, ***p < 0.001. b Heatmap of relative expression of MITF and its target genes (TRPM1, TYR and CDK2) and YAP/TEAD target genes (CTGF, NEGR and CYR61) in WM266-4, 501mel and A375 cells cultured on >1 GPa after treatment with 20 ng/ml TGFβ for 24 h. The expression of the respective genes in untreated cells was set 1 (see also colour key). c ChIP-PCR analysis in 501mel cells to assess enrichment of YAP at the MITF promoter of the following 20 ng/ml TGFβ treatment or YAP depletion. BSA-treated cells were used as baseline YAP-binding activity, and amplification of an intronic sequence of the MITF gene was used as a negative control. d ChIP-PCR analysis in 501mel cells to assess enrichment of YAP at the promoters of CYR61 and CTGF following 20 ng/ml TGFβ treatment or YAP depletion. BSA-treated cells were used as baseline YAP-binding activity. e Schematic of YAP-driven transcription in the presence or absence of TGFβ in the microenvironment. When TGFβ signalling is active, YAP interacts with TEAD/SMADs to drive the expression of CTGF, CYR61 and NEGR1 and inhibit YAP/PAX3-mediated transcription of MITF. f ChIP-PCR analysis in 501mel cells to assess enrichment of YAP at the promoters of MITF and CTGF following PAX3 depletion by RNAi. BSA-treated cells were used as baseline YAP-binding activity and amplification of an intronic sequence of the MITF gene was used as a negative control. Binding in the presence of a control siRNA was set 1. g Hierarchical clustering of gene expression data derived from the TCGA melanoma dataset stratified for ‘high collagen’ expression (229 patients, upper 50%). h Kaplan–Meier analysis using the TCGA melanoma dataset. Differences in overall survival in two cohorts (upper and lower 50%) with low and high COL1A1 expression are shown. n = 229 per cohort; Hazard ratio (HR) log-rank = 1.575 for high collagen (95% CI: 1.205–2.057); p (log-rank) = 0.0007. i Kaplan–Meier analyses using the TCGA melanoma dataset. Differences in overall survival for high and low expression of TRPM1 or CDK4, respectively, in the ‘high collagen’ group (n = 229) are shown. For TRPM1: hazard ratio (HR) log-rank 1.61 for high TRPM1 (95% CI: 1.107–2.36); p (log-rank) = 0.0073; for CDK4: hazard ratio (HR) log-rank 1.706 for high CDK4 (95% CI : 1.189–2.448); p (log-rank) = 0.0028

Similar articles

Cited by

References

    1. Hoek KS, Schlegel NC, Brafford P, Sucker A, Ugurel S, Kumar R, et al. Metastatic potential of melanomas defined by specific gene expression profiles with no BRAF signature. Pigment Cell Res. 2006;19:290–302. doi: 10.1111/j.1600-0749.2006.00322.x. - DOI - PubMed
    1. Kim IS, Heilmann S, Kansler ER, Zhang Y, Zimmer M, Ratnakumar K, et al. Microenvironment-derived factors driving metastatic plasticity in melanoma. Nat Commun. 2017;8:14343. doi: 10.1038/ncomms14343. - DOI - PMC - PubMed
    1. Pinner S, Jordan P, Sharrock K, Bazley L, Collinson L, Marais R, et al. Intravital imaging reveals transient changes in pigment production and Brn2 expression during metastatic melanoma dissemination. Cancer Res. 2009;69:7969–77. doi: 10.1158/0008-5472.CAN-09-0781. - DOI - PMC - PubMed
    1. Ahn A, Chatterjee A, Eccles MR. The slow cycling phenotype: a growing problem for treatment resistance in melanoma. Mol Cancer Ther. 2017;16:1002–9. doi: 10.1158/1535-7163.MCT-16-0535. - DOI - PubMed
    1. Arozarena I, Wellbrock C. Targeting invasive properties of melanoma cells. FEBS J. 2017;284:2148–62. doi: 10.1111/febs.14040. - DOI - PubMed

Publication types

MeSH terms