. 2018 Mar 9;8(1):4310.
doi: 10.1038/s41598-018-22558-5.

Phagocytosis depends on TRPV2-mediated calcium influx and requires TRPV2 in lipids rafts: alteration in macrophages from patients with cystic fibrosis

Affiliations

Phagocytosis depends on TRPV2-mediated calcium influx and requires TRPV2 in lipids rafts: alteration in macrophages from patients with cystic fibrosis

Manuella Lévêque et al. Sci Rep. .

Abstract

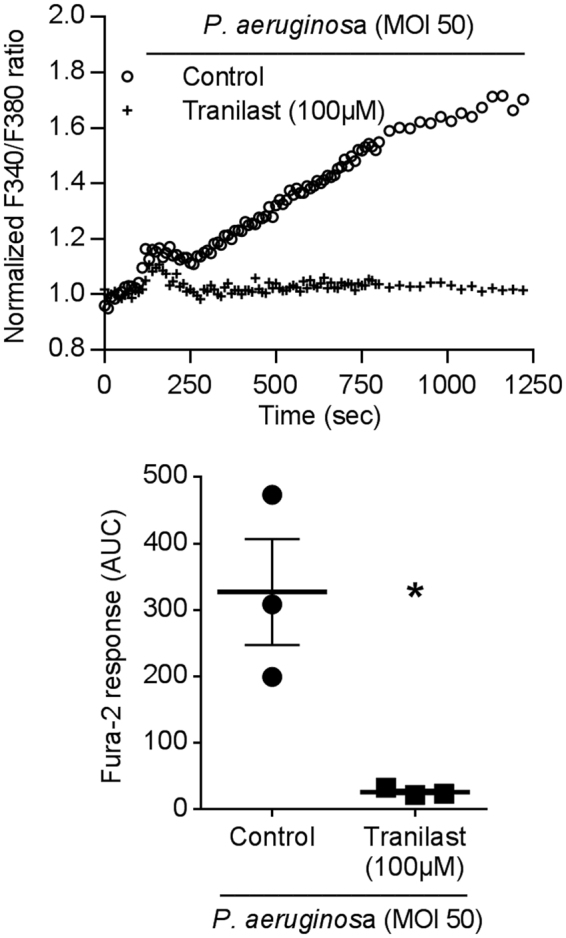
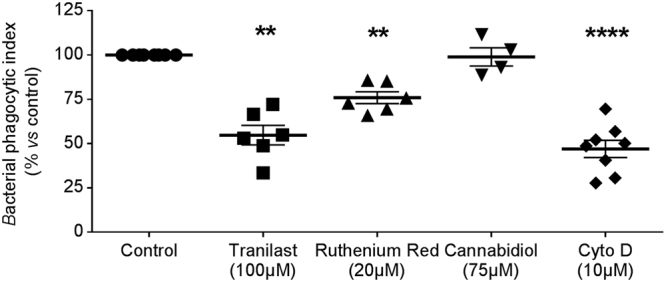
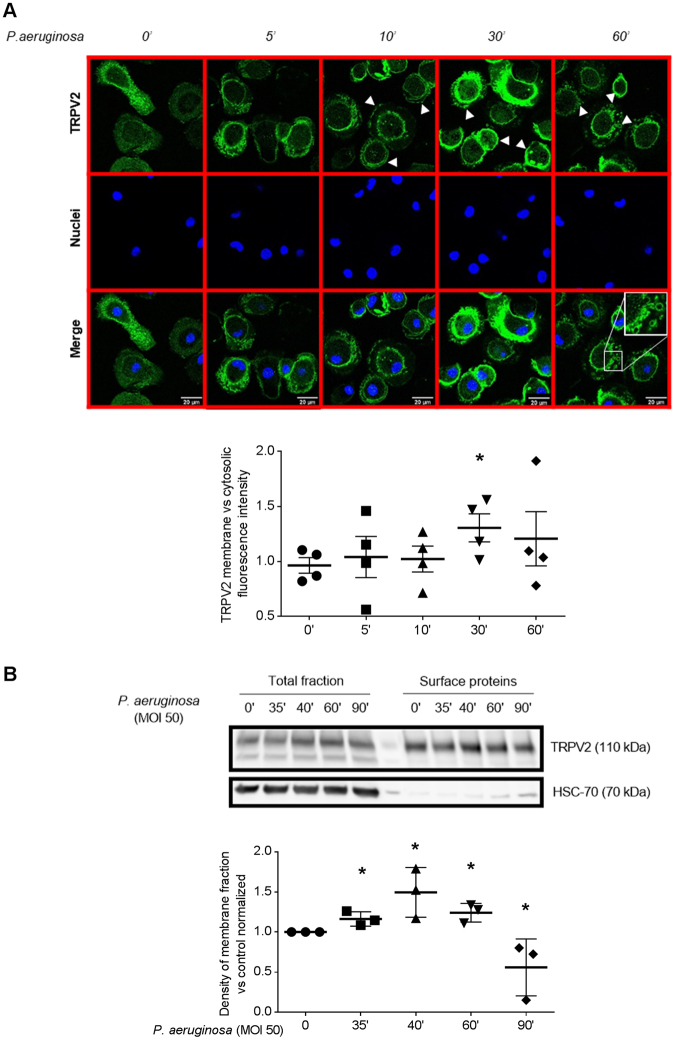
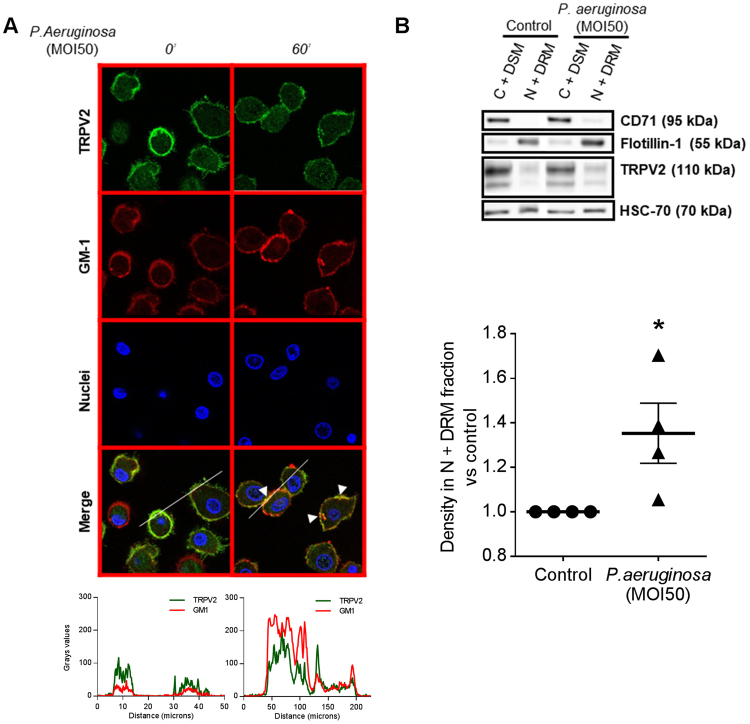
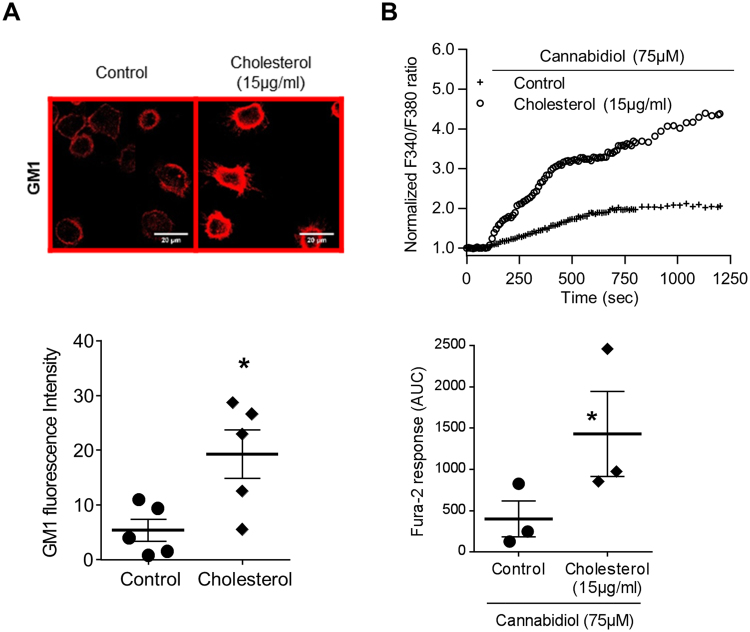
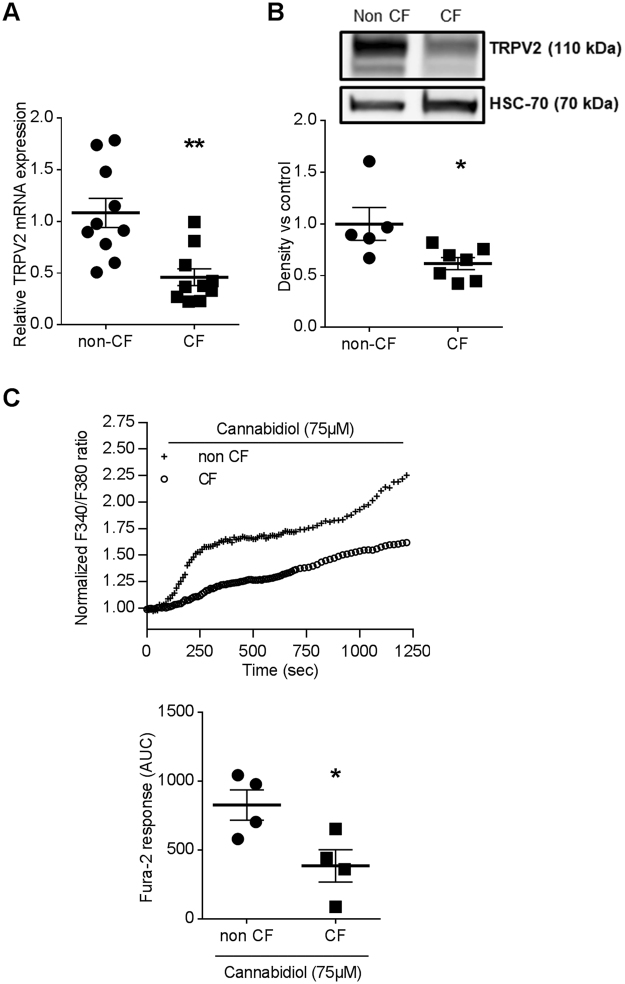
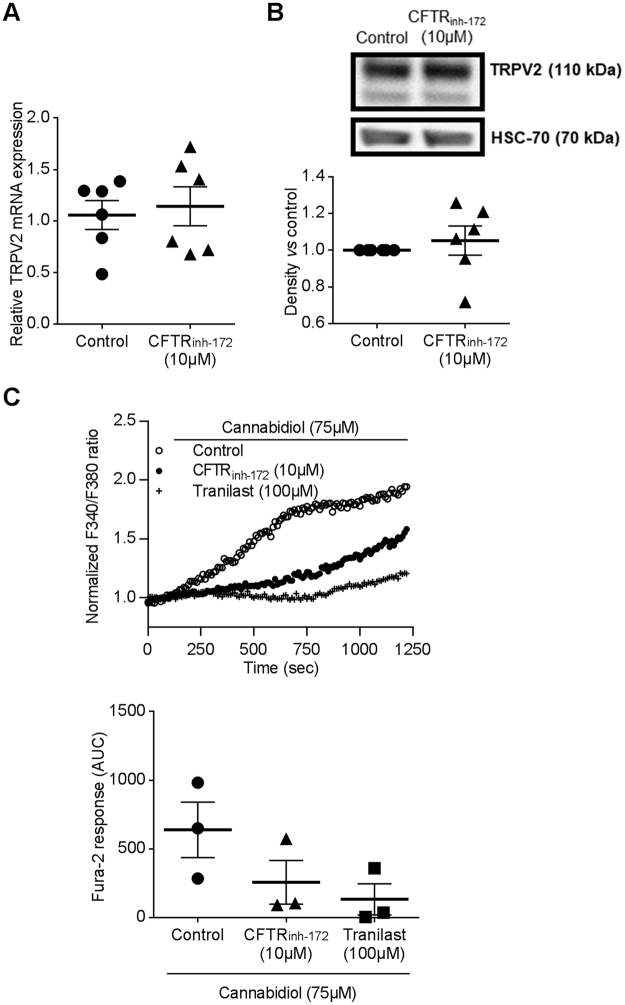
Whereas many phagocytosis steps involve ionic fluxes, the underlying ion channels remain poorly defined. As reported in mice, the calcium conducting TRPV2 channel impacts the phagocytic process. Macrophage phagocytosis is critical for defense against pathogens. In cystic fibrosis (CF), macrophages have lost their capacity to act as suppressor cells and thus play a significant role in the initiating stages leading to chronic inflammation/infection. In a previous study, we demonstrated that impaired function of CF macrophages is due to a deficient phagocytosis. The aim of the present study was to investigate TRPV2 role in the phagocytosis capacity of healthy primary human macrophage by studying its activity, its membrane localization and its recruitment in lipid rafts. In primary human macrophages, we showed that P. aeruginosa recruits TRPV2 channels at the cell surface and induced a calcium influx required for bacterial phagocytosis. We presently demonstrate that to be functional and play a role in phagocytosis, TRPV2 might require a preferential localization in lipid rafts. Furthermore, CF macrophage displays a perturbed calcium homeostasis due to a defect in TRPV2. In this context, deregulated TRPV2-signaling in CF macrophages could explain their defective phagocytosis capacity that contribute to the maintenance of chronic infection.


Conflict of interest statement

The authors declare no competing interests.

Figures

Figure 1
Figure 1
P. aeruginosa induced a TRPV2-mediated calcium influx in primary human macrophage. TRPV2 mediated-Ca2+ influx was measured in macrophages stimulated by P.aeruginosa (MOI 50) in the absence (control) or presence of tranilast (100 µM, 15 min preincubation). Data are depicted as the ratio of emission after excitation at 340 nm relative to that after excitation at 380 nm (F340/F380) and normalized to basal level 1. Horizontal bars represent stimulus period. Data are representative of three independent experiments. Below, area under the curve of similar experiments are shown as mean ± s.e.m. Mann-Whitney test: *p < 0.05 vs. control.
Figure 2
Figure 2
Phagocytosis is dependent on TRPV2 activation. Phagocytosis capacity was evaluated using heat-inactivated E. coli bound to fluorescein. Bacterial phagocytic index was determined under control condition or after treatment with tranilast (100 µM, n = 6), ruthenium red (20 µM, n = 6) and cannabidiol (75 µM, n = 4). Cytochalasin D (Cyto D, 10 µM) is used as negative control (n = 7). Data are shown as mean ± s.e.m. Each experiment was realized in quadruplicat. Mann-Whitney test: **p < 0.01 and ****p < 0.0001 vs. control.
Figure 3
Figure 3
P. aeruginosa-induced TRPV2 recruitment to plasma membrane. (A) Confocal pictures of TRPV2 localization in human primary macrophages after P. aeruginosa treatment (MOI 50, time 0 to 60 min). Images are representative of four separate experiments. Data representative of the TRPV2 surface relative to cytosolic fluorescence are shown below as mean ± s.e.m. Each point are representative of the fluorescence quantification of an average of 32 cells totally observed in at least three fields. Mann-Whitney test: *p < 0.05 vs. control. (B) Surface proteins biotinylation experiments in human macrophages treated with P. aeruginosa (MOI 50, time 35 to 90 min). Total cellular lysates and the biotinylated cell surface fractions were resolved on reducing gel and analyzed by immunoblotting. HSC-70 is used as control of membrane integrity. Representative blot of four separate experiments are shown. Densitometric analysis of TRPV2 surface expression are shown as mean ± s.e.m. Full-length blots are presented in Supplementary Figure 4. The results were expressed vs. the relative intensity observed at 0 min and normalized by total fraction. Mann-Whitney test: *p < 0.05 vs. control.
Figure 4
Figure 4
P. aeruginosa-induced TRPV2 recruitment into lipid rafts at the plasma membrane of macrophages. (A) Confocal images of TRPV2 localization in human primary macrophages after P. aeruginosa treatment (MOI 50, 60 min). Colocalization of TRPV2 staining with the raft marker dye, CTX-B, which recognizes the GM1 ganglioside. Data are representative of three independent experiments corresponding to an average of 63 cells from at least four fields each. Fluorescence profiles corresponding to the line are present below. (B) Human macrophages infected with P. aeruginosa (MOI 50, 60 min) were analyzed by quantitative separation of C + DSM (cytoplasm and detergent-soluble membrane) and N + DRM (nuclei and detergent-resistant membranes) fractions using lysis gradient centrifugation. Both fractions were resolved on reducing gel and analyzed by immunoblotting. Representative blots of four separate experiments are shown. CD71 and flotillin-1 are cell compartment markers for C + DSM and N + DRM respectively. In the histogram, the densitometric analysis of TRPV2 in the N + DRM fraction of the same experiments are shown as mean ± s.e.m. Full-length blots are presented in Supplementary Figure 4. The results were expressed vs. the relative intensity observed in control. Mann-Whitney test: *p < 0.05 vs. control.
Figure 5
Figure 5
Addition of exogenous cholesterol increased cannabidiol-induced TRPV2 calcium influx. (A) Confocal images with the raft marker dye, CTX-B, which recognize the GM1 ganglioside localization in human primary macrophages after cholesterol treatment (15 µg/ml). Images are representative of five separate experiments. Data representative of the GM1 fluorescence are shown below as mean ± s.e.m. Each point are representative of the fluorescence quantification of at least 30 cells coming from at least five fields. Mann-Whitney test: *p < 0.05 vs. control. (B) Fura-2 AM calcium measurement was performed in human macrophages stimulated by cannabidiol (75 µM) in the absence (control) or presence of cholesterol (15 µg/ml, 30 min pretreatment). Data are presented as the ratio of emission after excitation at 340 nm relative to that after excitation at 380 nm (F340/F380) and normalized to basal level 1. Horizontal bar represented stimulus period. Data are representative of three independent experiments. Below, area under the curve of similar experiments are shown as mean ± s.e.m. Mann Whitney test: *p < 0.05 vs. control.
Figure 6
Figure 6
Defective TRPV2 expression and activity in human CF macrophages. (A) TRPV2 gene expression in non-CF (n = 10) and CF macrophages (n = 10, patients 1–10, supplementary Table S1). TRPV2 mRNA expression were determined by RT-qPCR. Mann-Whitney test: **p < 0.01 vs. non-CF macrophages. (B) In a representative blot, TRPV2 (110 kDa) expression is observed on total cellular lysate from non-CF (n = 5) and CF (n = 8, patients 11–18, supplementary Table S1) macrophages. Equal protein loading was controlled via HSC70 detection. Full-length blots are presented in Supplementary Figure 4. The scatter dot plot represents densitometric analysis. Results are shown as the mean ± s.e.m. Mann-Whitney test: *p < 0.05 vs. non-CF macrophages. (C) Fura-2 AM calcium measurement in non-CF and CF macrophages stimulated by cannabidiol (75 µM) (n = 4, patients 19–22, supplementary Table S1). Data are presented as the ratio of emission after excitation at 340 nm relative to that after excitation at 380 nm (F340/F380), and normalized to basal level 1 and to maximal level 4 (ionomycin). Horizontal bar represented stimulus period. Below, area under the curve of similar experiments are shown as mean ± s.e.m. Mann-Whitney test: *p < 0.05 vs. non-CF macrophages.
Figure 7
Figure 7
CFTR inhibition decreased TRPV2 mediated-Ca2+ influx. (A) TRPV2 gene expression in macrophages treated or not with CFTRinh-172 (10 µM, 72 h pretreatment) (n = 6). TRPV2 mRNA expression was determined by RT-qPCR. (B) Representative blot of TRPV2 (110 kDa) protein level in total cellular lysate from human macrophage in the absence (control) or presence of CFTRinh-172 (10 µM, 72 h pretreatment). Equal protein loading was controlled via HSC70 detection. Immunoblots are representative of four independent experiments. Full-length blots are presented in Supplementary Figure 3. The scatter dot plot represents densitometric analysis. Results are shown as the mean ± s.e.m. (C) Fura-2 AM calcium measurement in human macrophages cells stimulated by cannabidiol (75 µM) in the absence (control) or presence of CFTRinh-172 (10 µM, 72 h pretreatment). Tranilast (100 µM) is used as control for inhibition of TRPV2 mediated-Ca2+ influx. Data are given as the ratio of emission after excitation at 340 nm relative to that after excitation at 380 nm (F340/F380), and normalized to basal level 1. Data are representative of three independent experiments. Below, area under the curve of similar experiments are shown as mean ± s.e.m. Mann Whitney test.

Similar articles

Cited by

References

    1. Aderem A, Underhill DM. Mechanisms of Phagocytosis in Macrophages. Annu. Rev. Immunol. 1999;17:593–623. doi: 10.1146/annurev.immunol.17.1.593. - DOI - PubMed
    1. Carrithers MD, et al. Expression of the voltage-gated sodium channel NaV1.5 in the macrophage late endosome regulates endosomal acidification. J. Immunol. Baltim. Md 1950. 2007;178:7822–7832. - PubMed
    1. Carrithers LM, Hulseberg P, Sandor M, Carrithers MD. The human macrophage sodium channel NaV1.5 regulates mycobacteria processing through organelle polarization and localized calcium oscillations. FEMS Immunol. Med. Microbiol. 2011;63:319–327. doi: 10.1111/j.1574-695X.2011.00853.x. - DOI - PubMed
    1. Hackam DJ, Rotstein OD, Schreiber A, Zhang W, Grinstein S. Rho is Required for the Initiation of Calcium Signaling and Phagocytosis by Fcγ Receptors in Macrophages. J. Exp. Med. 1997;186:955–966. doi: 10.1084/jem.186.6.955. - DOI - PMC - PubMed
    1. Hishikawa T, Cheung JY, Yelamarty RV, Knutson DW. Calcium transients during Fc receptor-mediated and nonspecific phagocytosis by murine peritoneal macrophages. J. Cell Biol. 1991;115:59–66. doi: 10.1083/jcb.115.1.59. - DOI - PMC - PubMed

Publication types