. 2018 Apr 11;18(4):2274-2281.
doi: 10.1021/acs.nanolett.7b04842. Epub 2018 Mar 9.

Quantifying Local Molecular Tension Using Intercalated DNA Fluorescence

Affiliations

Quantifying Local Molecular Tension Using Intercalated DNA Fluorescence

Graeme A King et al. Nano Lett. .

Abstract

The ability to measure mechanics and forces in biological nanostructures, such as DNA, proteins and cells, is of great importance as a means to analyze biomolecular systems. However, current force detection methods often require specialized instrumentation. Here, we present a novel and versatile method to quantify tension in molecular systems locally and in real time, using intercalated DNA fluorescence. This approach can report forces over a range of at least ∼0.5-65 pN with a resolution of 1-3 pN, using commercially available intercalating dyes and a general-purpose fluorescence microscope. We demonstrate that the method can be easily implemented to report double-stranded (ds)DNA tension in any single-molecule assay that is compatible with fluorescence microscopy. This is particularly useful for multiplexed techniques, where measuring applied force in parallel is technically challenging. Moreover, tension measurements based on local dye binding offer the unique opportunity to determine how an applied force is distributed locally within biomolecular structures. Exploiting this, we apply our method to quantify the position-dependent force profile along the length of flow-stretched DNA and reveal that stretched and entwined DNA molecules-mimicking catenated DNA structures in vivo-display transient DNA-DNA interactions. The method reported here has obvious and broad applications for the study of DNA and DNA-protein interactions. Additionally, we propose that it could be employed to measure forces in any system to which dsDNA can be tethered, for applications including protein unfolding, chromosome mechanics, cell motility, and DNA nanomachines.

Keywords: DNA; fluorescence microscopy; force sensor; intercalators; molecular tension.


Conflict of interest statement

The authors declare the following competing financial interest(s): The combined optical tweezers and fluorescence technologies and methods used in this article are patented and licensed to LUMICKS B.V., in which I.H., E.J.G.P., and G.J.L.W. have a financial interest.

Figures

Figure 1
Figure 1
Intercalated DNA fluorescence as an independent force sensor. (a) Sample fluorescence images of a λ-DNA molecule, held between two optically trapped microspheres (1.84 μm), in the presence of YO (10 nM) as the applied force is increased progressively from 6 pN to 60 pN through displacement of one of the microspheres. (b) Plot of the dsDNA tension as a function of the total fluorescence intensity for YO (10 nM, black) and SxO (6 nM, red; 20 nM, blue). The tension applied to the DNA was determined independently by standard back focal plane detection of the scattered optical trapping light from the stationary bead. Fits of these data to eq 1 (solid lines, with fit parameters detailed in Table S1) and a monoexponential function (dashed lines) are also displayed. Data were obtained in a buffer containing 20 mM HEPES pH 7.5, 100/150 mM NaCl, 2/10 mM MgCl2, 0.02% casein, and 0.05% Pluronics F127 for YO/SxO studies, respectively. All errors are SEM.
Figure 2
Figure 2
Hydrodynamic drag force on dsDNA can be determined from intercalator fluorescence intensity. (a) Experimental scheme, showing a dsDNA molecule (∼8.6 kb) tethered between the surface of a flow-cell and a bead of 1.76 μm diameter. The DNA molecule is stretched by using hydrodynamic flow to impart a drag force on the bead. (b) Left: Sample fluorescence images of a flow-stretched dsDNA molecule in the presence of SxO (20 nM) as the flow is increased (stepwise, frames 1–9). Right: Corresponding kymograph from which the snapshots were extracted. Arrows indicate the force jumps induced by increasing the flow. (c) Average DNA tension as a function of pressure level (which governs the hydrodynamic flow). The force was calculated using eq 1, while the flow was tuned through the pressure applied to the reservoir containing the intercalator solution. Note that black data points correspond to the snapshots in panel (b), while red data points are derived from fluorescence images of a second surface-tethered DNA molecule (Figure S4 and Movie S2). Data were obtained in a buffer containing 20 mM HEPES pH 7.5, 150 mM NaCl, 10 mM MgCl2, 0.05% casein, and 0.1% Pluronics F127.
Figure 3
Figure 3
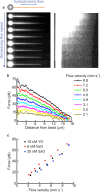
Quantifying heterogeneous tension along a flow-stretched dsDNA molecule. (a) Inset presents a schematic illustration of the experimental scheme: a λ-DNA molecule, tethered on one end to an optically trapped bead (1.84 μm diameter), is stretched by hydrodynamic flow (blue arrow) in the presence of intercalator dye. The left main panel displays sample fluorescence images obtained as the DNA is stretched using different flow velocities in the presence of SxO (20 nM). The corresponding kymograph is shown on the right, with the contrast enhanced to enable visualization of the free end of the dsDNA. (b) Tension along the length of the DNA molecule shown in panel (a) (left, main) for different flow velocities. The tension over the different segments of the DNA was derived using eq 1. The flow velocity was calculated using Stokes’ law (see Supplementary Note 2). (c) Comparison of the maximum force, near the tethered end of the dsDNA molecule (calculated from the fluorescence profile), as a function of flow velocity for two different dyes: YO (10 nM) and SxO (6 nM, 20 nM). Data were obtained in a buffer containing 20 mM HEPES pH 7.5, 100/150 mM NaCl, 2/10 mM MgCl2, 0.02% casein, and 0.05% Pluronics F127 for YO/SxO studies, respectively.
Figure 4
Figure 4
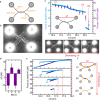
Quantifying DNA–DNA interactions within stretched and entwined dsDNA molecules. (a) An entwined dsDNA architecture is created by wrapping one λ-DNA molecule (tethered between optically trapped beads #1 and #2) around another (held between beads #3 and #4). (b) Sample fluorescence image of the entwined DNA structure in the presence of SxO (20 nM). Four regions of interest (ROI) are established, one on each “arm” of the construct. (c) Inset: Tension is applied, and then released, by increasing and decreasing the distance between bead #1 and bead #2 (Δd), respectively, via displacement of bead #2. Upper panel: Measured tension within arm I as Δd is decreased (after its initial extension). Data in purple are based on the changes in SxO fluorescence intensity within ROI #1 (calculated using eq 2); data in blue are derived using back focal plane detection of the scattered optical trapping light from bead #1. Lower panel: Fluorescence images (of SxO) recorded at maximum Δd (i), directly before (ii) and after (iii) the sudden drop in force identified in the upper panel. (d) Rearrangements in local force between frames (ii) and (iii), determined using the change in fluorescence intensity within ROI #1, ROI #2, ROI #3, and ROI #4, respectively. (e) Force measured on bead #1 directly (via back focal plane detection of the scattered optical trapping light) upon increasing (dark blue) and then decreasing (light blue) Δd. From bottom to top, panels show the effect of increasing the maximum value of Δd (highlighted by the red arrows). (f) Schematic illustration of the change in fluorescence intensity (i.e., local DNA tension) as Δd is decreased, corresponding to the images shown in (i)–(iii) in panel (c). At a critical force, a DNA–DNA interaction is induced that locks the DNA molecules together at the point of intersection (blue circle). Consequently, upon moving bead #2 back to its initial location, the tension in the orthogonal arms (I/III) cannot be released to the same extent as in arms II/IV (which are near-parallel to the translational axis of bead #2). Once the inter–DNA interaction is broken (signified by the jump in force in Figure 4 panel c), the remaining tension is redistributed within the four arms. In this scheme, the local DNA tension in the different arms is indicated by the line thickness (orange). All data were obtained in a buffer of 20 mΜ Tris-HCl pH 7.6 and 50 mM NaCl. Errors are SEM.
Figure 5
Figure 5
Stick–slip sliding dynamics observed within entwined dual-DNA architectures. (a) Upper panel shows a schematic representation of the experimental assay: using the four-bead geometry described in Figure 4a, beads #3 and #4 are displaced simultaneously (rightwards or leftwards) with respect to beads #1 and #2. Lower panel shows sample fluorescence images of the entwined DNA structure in the presence of SxO (20 nM) as beads #3 and #4 are displaced. (b) Kymograph showing the point of intersection as beads #3 and #4 are displaced. (c) Plot showing the force measured from the kymograph in panel (b) (determined using eq 2), as well as the change in position of the intersection point of the two dsDNA molecules (Δd) as beads #3 and #4 are displaced. The largest ruptures in force correspond to discrete changes in Δd, as highlighted by the gray-colored domains in panel (c). All data were obtained in a buffer of 20 mM Tris-HCl pH 7.6 and 50 mM NaCl.

Similar articles

Cited by

References

    1. Eyckmans J.; Boudou T.; Yu X.; Chen C. S. Dev. Cell 2011, 21, 35–47. 10.1016/j.devcel.2011.06.015. - DOI - PMC - PubMed
    1. Sheetz M. P.; Felsenfeld D. P.; Galbraith C. G. Trends Cell Biol. 1998, 8, 51–54. 10.1016/S0962-8924(98)80005-6. - DOI - PubMed
    1. Vicente-Manzanares M.; Ma X.; Adelstein R. S. Nat. Rev. Mol. Cell Biol. 2009, 10, 778–790. - PMC - PubMed
    1. Sharp D. J.; Rogers G. C.; Scholey J. M. Nature 2000, 7, 41–47. 10.1038/35024000. - DOI - PubMed
    1. Dogterom M.; Kerssemakers J. W. J.; Romet-Lemonne G.; Janson M. E. Curr. Opin. Cell Biol. 2005, 17, 67–74. 10.1016/j.ceb.2004.12.011. - DOI - PubMed

Publication types

LinkOut - more resources