. 2018 Mar 1;22(3):445-453.e5.
doi: 10.1016/j.stem.2018.01.017. Epub 2018 Feb 15.

CD150high Bone Marrow Tregs Maintain Hematopoietic Stem Cell Quiescence and Immune Privilege via Adenosine

Affiliations

CD150high Bone Marrow Tregs Maintain Hematopoietic Stem Cell Quiescence and Immune Privilege via Adenosine

Yuichi Hirata et al. Cell Stem Cell. .

Abstract

A crucial player in immune regulation, FoxP3+ regulatory T cells (Tregs) are drawing attention for their heterogeneity and noncanonical functions. Here, we describe a Treg subpopulation that controls hematopoietic stem cell (HSC) quiescence and engraftment. These Tregs highly expressed an HSC marker, CD150, and localized within the HSC niche in the bone marrow (BM). Specific reduction of BM Tregs achieved by conditional deletion of CXCR4 in Tregs increased HSC numbers in the BM. Adenosine generated via the CD39 cell surface ectoenzyme on niche Tregs protected HSCs from oxidative stress and maintained HSC quiescence. In transplantation settings, niche Tregs prevented allogeneic (allo-) HSC rejection through adenosine and facilitated allo-HSC engraftment. Furthermore, transfer of niche Tregs promoted allo-HSC engraftment to a much greater extent than transfer of other Tregs. These results identify a unique niche-associated Treg subset and adenosine as regulators of HSC quiescence, abundance, and engraftment, further highlighting their therapeutic utility.


Conflict of interest statement

Declaration of Interests

The authors have declared that no conflicting interests exist.

Figures
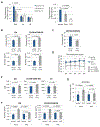
Figure 1.
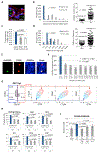
Figure 1.. BM Tregs maintain HSC quiescence and pool size by reducing oxidative stress.
A. Treg frequencies in CD4+CD3+NK1.1- T cells (left) and BM mononuclear cells (right) of mice with conditional deletion of CXCR4 in Tregs. fl/fl: FoxP3cre CXCR4fl/fl mice. fl/wt: FoxP3cre CXCR4fl/wt mice. wt/wt: control FoxP3cre CXCR4wt/wt littermates. B. Frequencies and numbers of HSPCs and HSCs in FoxP3cre CXCR4fl/fl mice. HSPC and HSC numbers in one tibia and one femur were analyzed. These results were reproducible in five independent experiments (total 17–20 mice/group; refer to Table S1). Data were pooled from two independent experiments. C. Ki67- cell frequencies in HSCs in FoxP3cre CXCR4fl/fl mice. The results were reproducible in two independent experiments (total seven-eight mice/group). Data from a representative experiment are shown here. D. Donor blood chimerism in 9.5Gy-irradiated SJL mice receiving FoxP3-YFPcre CXCR4fl/fl or FoxP3-YFPcre CXCR4wt/wt BM cells (CD45.2) together with SJL BM cells. BM cells from each donor mouse (n=9) were transplanted into one-two recipients (total 15–17 mice/group). E. ROS levels in HSPCs and HSCs. Flow cytometric analysis was performed following incubation of BM cells with 2uM CellROX Deep Red (Invitrogen) for 30 minutes. These results were reproducible in two independent experiments (total seven-nine mice/group). Data from a representative experiment are shown here. F. Numbers of HSCs and HSPCs in FoxP3-YFPcre CXCR4fl/fl mice receiving NAC treatment (daily; sc; 100 mg/kg for four weeks). These results were reproducible in two independent experiments (total seven mice/group). Data from a representative experiment (three mice) are shown here. G. Donor blood chimerism in lethally irradiated SJL mice receiving SJL BM cells together with BM cells of NAC-treated FoxP3-YFPcre CXCR4fl/fl or FoxP3-YFPcre CXCR4wt/wt mice. BM cells from each donor mouse (n=6–7) were transplanted into one-two recipients (total n=12/group). Data are presented as mean ± SD.
Figure 2.
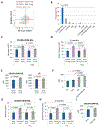
Figure 2.. Potent CD150high Tregs in the perivascular niche regulate HSCs.
A. In vivo imaging of Tregs (green) adjacent to CXCL12-DsRedhigh perivascular cells (purple) in the skull BM of a FoxP3-GFP × CXCL12-DsRed mouse 1 hour after intravenous injection of Alexa647-conjugated Isolectin GS-IB4. Red: sinusoidal vessels. White: Bone. The white bar indicates 20 μm. B. Distances from Tregs to CXCL12-DsRedhigh cells. We analyzed 3D image stacks of the skull BM (2540 μm [x] × 2570 μm [y] × 150 μm [z]) of FoxP3-GFP × CXCL12-DsRed mice or global-GFP × CXCL12-DsRed mice (control). These results were reproducible in three mice. A representative figure is shown here. C. Treg frequencies in BM mononuclear cells in mice with conditional deletion of CXCL12 in lepr+ cells. The results were reproducible in an additional experiment. D. Distances from CD150+CD48-Lin- HSCs or control (CD48+ or Lin+) cells with respect to the nearest observable FoxP3-GFP Tregs in the tibia BM of B6 FoxP3-GFP mice. Data from five FoxP3-GFP mice were pooled. E. Histological image of CD150high Tregs (whitish-yellow) adjacent to CD150+CD48-Lin- HSCs (red). Green: FoxP3-GFP. Red: CD150. Blue: CD48 or Lin. CD150+ Tregs (whitish-yellow cells) express CD150 (red), FoxP3-GFP (green), and Lin (blue). F. Frequencies of CD150high cells among different Treg fractions (y-axis) categorized by their distance (x-axis) from the nearest observable HSC in the tibia BM (x-axis). CD150high Tregs were defined as Tregs that expressed CD150 at levels in the top 35% of relative fluorescence units across all observable BM Tregs. P-values were determined by comparing frequencies of CD150high cells in Tregs within 25 μm of HSCs with those in Tregs within more than 25 μm of HSCs. Data from three FoxP3-GFP mice were pooled. G. Flow cytometric analysis of BM FoxP3+ Tregs. H. Flow cytometric analysis of CD150high BM Tregs, CD150low BM Tregs, and LN Tregs. CD150high Tregs were defined as Tregs that expressed CD150 at levels in the top 30% of all BM Tregs, and CD150low Tregs cells were those in the bottom 70%. These results were reproducible in three independent experiments (total 10 mice). Data from a representative experiment (three-four mice) are shown here. I. HSC numbers in FoxP3cre CXCR4fl/fl mice 5 days after intravenous injection of CD150high BM Tregs, CD150low BM Tregs or CD4+FoxP3- BM T cells (30,000 cells/mouse). Data were pooled from three independent experiments. Data are presented as mean ± SD.
Figure 3.
Figure 3.. Adenosine generated via CD39 of niche Tregs maintains HSC quiescence and pool size by reducing oxidative stress.
A. Flow cytometric analysis of CD39 and CD73 expression levels by CD150high BM Tregs, CD150low BM Tregs, and whole BM cells. B. Frequencies of CD39highCD73high cells in different BM cell populations in B6 mice. Treg: CD4+CD3+NK1.1-FoxP3GFP+ cells. Non-Treg: CD4+CD3+NK1.1-FoxP3GFP- cells. CD8 T: CD8+CD3+NK1.1-T cells. B cell: B220+ cells. HSPC: KSLs. CD39highCD73high cells correspond to the cell population of the upper right quadrant in the figure A. These results were reproducible in two independent experiments (total eight mice). A representative figure from one experiment (four mice) is shown here. C. HSC numbers in NAC treated or non-treated FoxP3cre CD39fl/wt mice. NAC treatment was given orally via drinking water (1mg/ml; four weeks). These results were reproducible in two independent experiments (total eight-ten mice/group; refer to Table S2). Data analyzed by 1-way ANOVA with Bonferroni posttest. D. Donor blood chimerism in lethally irradiated mice receiving wild-type SJL BM cells (CD45.1) together with BM cells of NAC treated or non-treated FoxP3cre CD39wt/wt mice (CD45.2). BM cells from each donor mouse (total seven to nine mice/group) were transplanted into one-two recipient (total 12–18 mice/group). Analysis was performed 5 months after transplantation. E. ROS levels in HSCs in FoxP3cre CD39fl/wt mice. These results were reproducible in two independent experiments (nine-ten mice/group total). A representative figure from one independent experiment is shown here. F. Expression levels of adenosine 2A receptors. MFI: mean fluorescence intensity. Experiment includes four mice. G. HSC numbers in mice that received ZM241385 (daily; 200 μg/mouse; i.p.; 21 days) and/or NAC treatments (1mg/ml in drinking water). These results were pooled from two independent experiments (total eight mice/group). H. Donor blood chimerism in lethally irradiated mice transplanted with SJL BM cells (CD45.1) together with BM cells isolated from B6 mice (CD45.2) that received ZM241385 and/or NAC treatments. Analysis was performed four months after transplantation. These results were pooled from three independent experiments (12–20 mice/group total). I. ROS levels in HSCs in ZM241385 treated mice. These results were reproducible in two independent experiments (eight mice/group total). A representative figure from one independent experiment is shown here. Data are presented as mean ± SD.
Figure 4.
Figure 4.. The role of niche Tregs and adenosine in allo-HSC engraftment.
A. Allo- or syn-donor chimerism in the peripheral blood of FoxP3cre CXCR4fl/wt or FoxP3cre CXCR4wt/wt mice nine and 24 weeks after transplantation. Recipient mice (B6) received 3-Gy irradiation followed by intravenous injection of MHC-mismatched B10.A BM cells or syngeneic B6 SJL BM cells (2 × 10⁷/each). Anti-CD8 mAb was intraperitoneally injected on day –1 and anti-mouse CD40L mAb on day 0. Experiment included four recipients/group. Data were reproduced by an additional experiment (five mice/group). B. Allo-donor blood chimerism in FoxP3cre CD39wt/wt recipient mice. Experiment included five recipients/group. C. Allo-donor chimerism in recipients receiving adoptive transfer of CD150high or CD150low BM Tregs or LN Tregs (30,000 cells/mouse). B6 wild-type recipients received 2.5-Gy irradiation followed by intravenous injection of MHC-mismatched BALB/c BM cells (2 × 10⁷ each). Anti-CD8 mAb was intraperitoneally injected on day −1 and anti-mouse CD40L mAb on day 0. Tregs were injected into the tail veins of the recipients on day −2. Analysis was performed seven weeks after transplantation. Data were pooled from two independent experiments (six recipients/group total). Data are presented as mean ± SD.

Similar articles

Cited by

References

    1. Arpaia N, Green JA, Moltedo B, Arvey A, Hemmers S, Yuan S, Treuting PM & Rudensky AY (2015). A Distinct Function of Regulatory T Cells in Tissue Protection. Cell, 162, 1078–89. - PMC - PubMed
    1. Azab AK, Runnels JM, Pitsillides C, Moreau AS, Azab F, Leleu X, Jia X, Wright R, Ospina B, Carlson AL, et al. (2009). CXCR4 inhibitor AMD3100 disrupts the interaction of multiple myeloma cells with the bone marrow microenvironment and enhances their sensitivity to therapy. Blood, 113, 4341–51. - PMC - PubMed
    1. Bapat SP, Myoung Suh J, Fang S, Liu S, Zhang Y, Cheng A, Zhou C, Liang Y, Leblanc M, Liddle C, et al. (2015). Depletion of fat-resident Treg cells prevents age-associated insulin resistance. Nature, 528, 137–41. - PMC - PubMed
    1. Burzyn D, Kuswanto W, Kolodin D, Shadrach JL, Cerletti M, Jang Y, Sefik E, Tan TG, Wagers AJ, Benoist C, et al. (2013). A special population of regulatory T cells potentiates muscle repair. Cell, 155, 1282–95. - PMC - PubMed
    1. Cao H, Heazlewood SY, Williams B, Cardozo D, Nigro J, Oteiza A & Nilsson SK (2016). The role of CD44 in fetal and adult hematopoietic stem cell regulation. Haematologica, 101, 26–37. - PMC - PubMed

Publication types

MeSH terms

Substances