. 2018 Apr 13;293(15):5731-5745.
doi: 10.1074/jbc.RA117.000808. Epub 2018 Feb 13.

High dietary fat and sucrose results in an extensive and time-dependent deterioration in health of multiple physiological systems in mice

Affiliations

High dietary fat and sucrose results in an extensive and time-dependent deterioration in health of multiple physiological systems in mice

James G Burchfield et al. J Biol Chem. .

Abstract

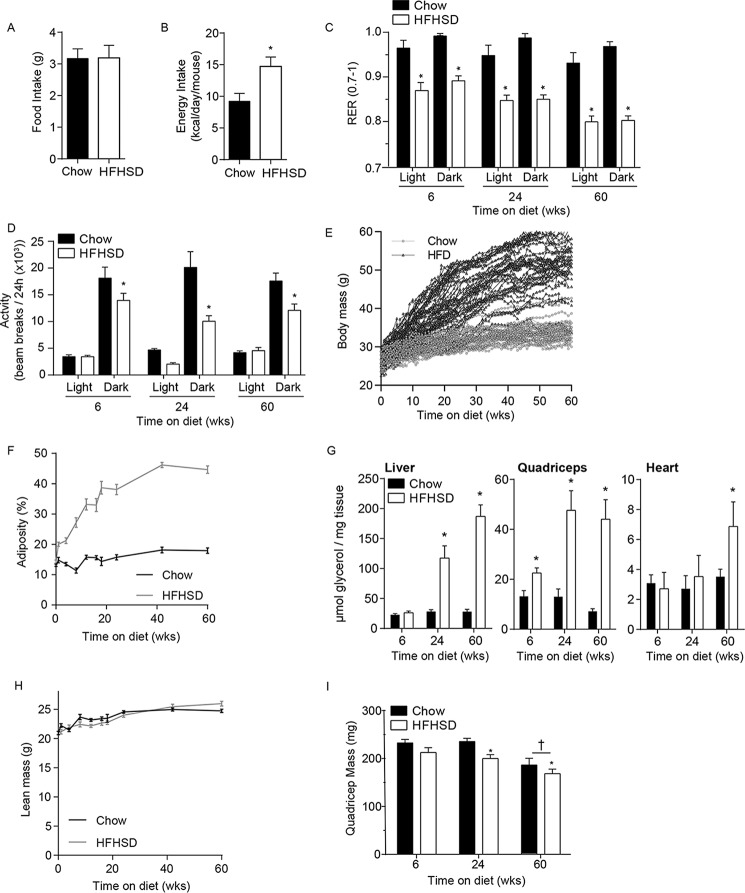
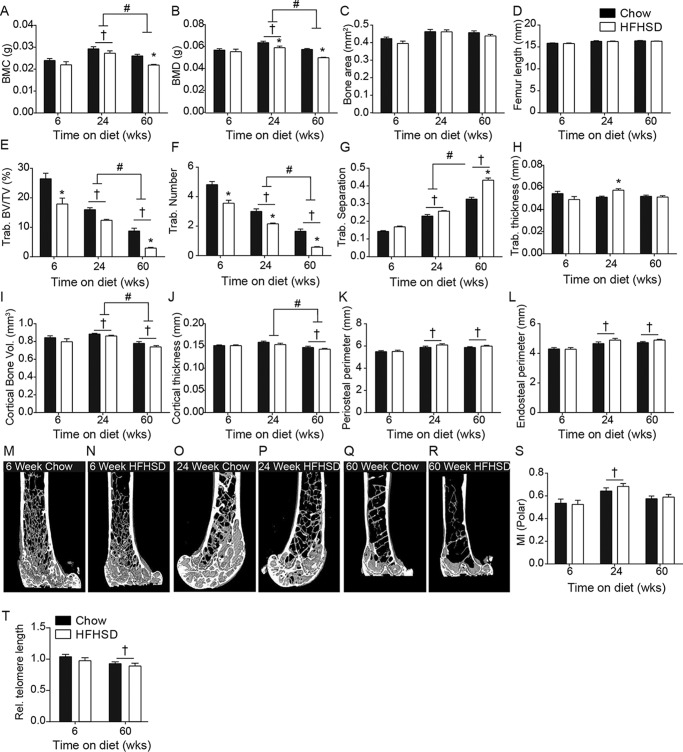
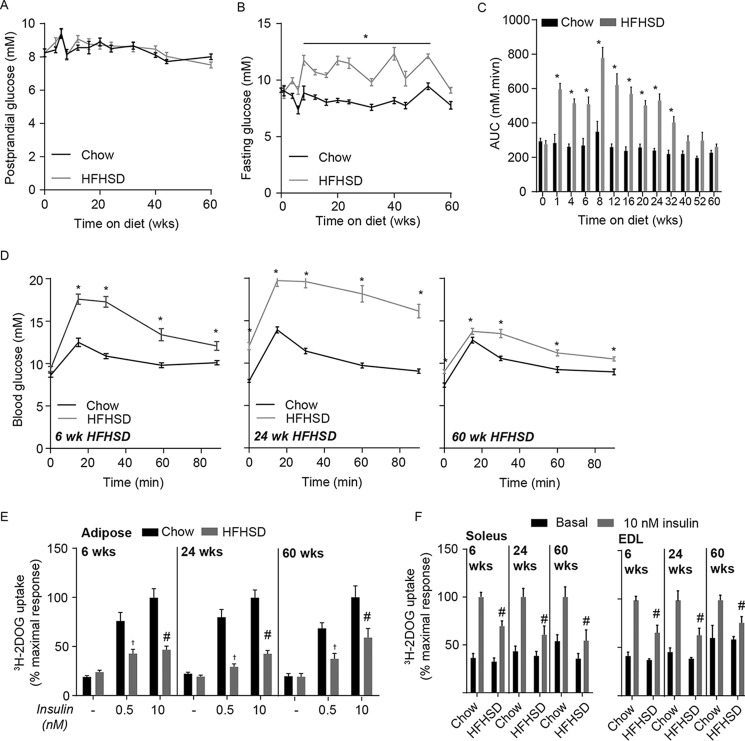
Obesity is associated with metabolic dysfunction, including insulin resistance and hyperinsulinemia, and with disorders such as cardiovascular disease, osteoporosis, and neurodegeneration. Typically, these pathologies are examined in discrete model systems and with limited temporal resolution, and whether these disorders co-occur is therefore unclear. To address this question, here we examined multiple physiological systems in male C57BL/6J mice following prolonged exposure to a high-fat/high-sucrose diet (HFHSD). HFHSD-fed mice rapidly exhibited metabolic alterations, including obesity, hyperleptinemia, physical inactivity, glucose intolerance, peripheral insulin resistance, fasting hyperglycemia, ectopic lipid deposition, and bone deterioration. Prolonged exposure to HFHSD resulted in morbid obesity, ectopic triglyceride deposition in liver and muscle, extensive bone loss, sarcopenia, hyperinsulinemia, and impaired short-term memory. Although many of these defects are typically associated with aging, HFHSD did not alter telomere length in white blood cells, indicating that this diet did not generally promote all aspects of aging. Strikingly, glucose homeostasis was highly dynamic. Glucose intolerance was evident in HFHSD-fed mice after 1 week and was maintained for 24 weeks. Beyond 24 weeks, however, glucose tolerance improved in HFHSD-fed mice, and by 60 weeks, it was indistinguishable from that of chow-fed mice. This improvement coincided with adaptive β-cell hyperplasia and hyperinsulinemia, without changes in insulin sensitivity in muscle or adipose tissue. Assessment of insulin secretion in isolated islets revealed that leptin, which inhibited insulin secretion in the chow-fed mice, potentiated glucose-stimulated insulin secretion in the HFHSD-fed mice after 60 weeks. Overall, the excessive calorie intake was accompanied by deteriorating function of numerous physiological systems.

Keywords: Western diet; beta cell (B-cell); bone; diabetes; glucose metabolism; insulin secretion; leptin; neurodegeneration; obesity.


Conflict of interest statement

The authors declare that they have no conflicts of interest with the contents of this article

Figures

Figure 1.
Figure 1.
High-fat high-sucrose diet increases body weight and adiposity. A and B, food intake (A) was measured after 60 weeks of either chow (black bars) or HFHSD (white bars) feeding, and daily energy intake (kcal/day/mouse) was calculated (B). Data are mean ± S.E., Mann-Whitney, n = 7 chow-fed and = 8 HFHSD mice, *, p < 0.05 versus chow-fed controls. C and D, respiratory exchange ratios (C) and activity (number of beam crosses within 24 h) (D) were assessed in mice fed chow or a HFHSD for the indicated times (wks = weeks). Data were separated in to light and dark cycles. Data are mean ± S.E., n = 4 chow-fed and HFHSD for 6 weeks, 4 chow-fed and HFHSD for 24 weeks, and 8 chow-fed and HFHSD for 60 weeks, and t tests were corrected for multiple comparisons, *, p < 0.05 versus age-matched chow-fed controls. E and F, body mass n = 28–54 mice for chow-fed and 27–54 for HFD (E) and percentage adiposity, n = 8–24 mice for chow-fed and 10–31 for HFHSD (F) of mice fed a chow (black line) or a HFHSD (gray line) for the indicated times. G, triglyceride content in liver, quadriceps, and heart tissue from mice fed a chow or a HFHSD for indicated times, n = 9–23 for quadriceps, 9–10 for liver, and 3–9 for heart. H and I, total lean mass, n = 28–54 for chow-fed mice and 27–54 for HFHSD mice (H), and quadriceps mass, n = 9–10 (I), in mice fed a chow or HFHSD for indicated times. Data are mean ± S.E., t-tests corrected for multiple comparisons (G and I), *, p < 0.05, versus chow-fed age-matched controls; †, p < 0.05 versus mice fed either diet for 6 weeks (I).
Figure 2.
Figure 2.
High-fat high-sucrose diet rapidly impairs skeletal structure. A–C, femora were isolated from mice fed chow (black bars) or HFHSD (white bars) for 6, 24, and 60 weeks (wks) and DEXA scanning utilized to measure femoral bone mineral content (BMC) (A), bone mineral density (BMD) (B), and bone area (C). D, length of femurs from mice fed chow or HFHSD for indicated times. E–H, μCT scanning of tarbecular bone from mice fed chow or HFHSD for indicated times assessed trabecular bone volume/total volume (E), trabecular number (F), trabecular separation (G), and trabecular thickness (H). I and J, cortical bone from mice fed chow or HFHSD for indicated times was assessed for cortical bone volume (I) and cortical thickness (J). K and L, periosteal (K) and endosteal (L) perimeters were measured from mice fed chow or HFHSD for indicated times. M–R, representative images showing the loss in trabecular bone volume and trabecular number and changes in cortical thickness in mice fed chow or HFHSD for 6 (M and N), 24 (O and P), and 60 (Q and R) weeks, respectively. S, polar moment of inertia (was calculated using the Skyscan CT analyzer software as an indicator of bone strength in isolated femurs. T, relative telomere length in mice fed a chow or HFHSD for 6 or 60 weeks. Data are mean ± S.E., n = 10, 10, and 18 mice per group for 6, 12, and 60 weeks, respectively; t tests corrected for multiple comparisons;*, p < 0.05 versus age-matched chow; †, p < 0.05 versus mice fed either diet for 6 weeks; #, p < 0.05 versus mice fed either diet for 24 weeks as indicated.
Figure 3.
Figure 3.
Prolonged high-fat high-sucrose diet feeding impairs short term memory. A–C, hippocampal Aβ 42 (A) and 40 (B) were measured and the Aβ-40/42 ratio calculated for mice fed a chow (black bars) or HFHSD (white bars) for indicated times (weeks = weeks) (C). D–H, mice fed a chow or HFHSD for 60 weeks were subjected to the open field test (D and E), elevated plus-maze (F), and Y-maze (G and H). The open field test provided a measure of locomotion (D) and anxiety as measured by time in the center of the apparatus (E). F, elevated plus-maze directly measured anxiety by quantifying time in open arms of the maze. G and H, Y-maze provided a measured of activity (G) by measuring number of entries into arms of the maze and short term spatial memory by quantifying the number of entries into alternate arms of the maze (alternations) (H). Data are mean ± S.E., n = 5 per group for 6- and 24-week-old mice, n = 8 for 60-week chow-fed and n = 11 for 60-week HSHFD mice. t tests corrected for multiple comparison; *, p < 0.05 versus age matched chow; †, p < 0.05 versus mice fed either diet for 6 weeks as indicated.
Figure 4.
Figure 4.
Glucose tolerance in high-fat high-sucrose diet fed mice resolves with prolonged exposure to high-fat high-sucrose diet. A and B, postprandial (A), n = 18–41 and fasting (B), n = 10–30, blood glucose concentrations in mice fed a chow (black line) or HFHSD (gray line) for indicated times (wks = weeks). Data are mean ± S.E., t tests corrected for multiple comparisons; *, p < 0.05 versus chow-fed controls. C, area under the curve calculated from blood glucose concentrations during glucose tolerance tests in mice fed a chow (black bars) or HFHSD (gray bars) for indicated times. Data are mean ± S.E., n = 7–42; t tests corrected for multiple comparisons; *, p < 0.05 versus chow-fed age-matched controls. D, representative blood glucose concentrations during a glucose tolerance test in C57BL/6J mice fed a chow or HFHSD for 6, 24, or 60 weeks. Data are mean ± S.E., n = 20–25 at 6 weeks, 38–39 at 24 weeks, 20–26 at 60 weeks, t tests corrected for multiple comparisons, *, p < 0.05 versus chow-fed controls. E, rates of 2-[3H]DOG uptake into epididymal adipose explants from mice fed a chow or HFHSD for 6, 24, or 60 weeks under unstimulated conditions and in response to 0.5 or 10 nm insulin. Data are mean ± S.E., n = 4–10, t tests corrected for multiple comparisons; †, p < 0.05 versus 0.5 nm insulin chow mice; #, p < 0.05 versus 10 nm insulin chow mice. F, rates of 2-[3H]DOG uptake into isolated soleus muscles (left panel) or EDL (right panel) muscles from mice fed a chow or HFHSD for 6, 24, or 60 weeks under unstimulated conditions (basal) and in response 10 nm insulin. Data are mean ± S.E., n = 5–14, t tests corrected for multiple comparisons;, #, p < 0.05 versus 10 nm chow.
Figure 5.
Figure 5.
Prolonged high-fat high-sucrose diet feeding induces hyperinsulinemia. A–D, concentrations of leptin (A), resistin (B), IL6 (C), and gastric inhibitory polypeptide (GIP) (D) in serum from mice fed a HFHSD (white bars) for indicated times and chow-fed controls (black bars) (wks = weeks). Data are mean ± S.E., n = 4–12, t tests corrected for multiple comparisons; *, p < 0.05 versus chow-fed controls. Postprandial (E) and fasting (F) circulating insulin levels in mice fed a HFHSD (gray line) for specified times and chow-fed controls (black line) are shown. Data are mean ± S.E., n = 7–30, t tests corrected for multiple comparisons; *, p < 0.05 versus chow-fed controls. G–I, circulating insulin (G) and C-peptide (H) concentrations during an i.p. GTT following an overnight fast in mice fed chow or HFHSD for 60 weeks. The C-peptide/insulin ratio (I) was calculated from G and H. Data are mean ± S.E., n = 8–9, t tests corrected for multiple comparisons, *, p < 0.05 versus chow-fed controls.
Figure 6.
Figure 6.
β-Cell hyperplasia in high-fat high-sucrose diet-fed mice. A, representative images of pancreatic slices from mice fed a HFHSD for indicated times (wks = weeks) and chow-fed controls stained for nuclei (DAPI, blue), insulin (red), and glucagon (green). B, pancreatic mass from mice fed chow (black bars) or HFHSD (white bars) for indicated times. Data are mean ± S.E., t tests corrected for multiple comparisons; *, p < 0.05 versus chow-fed controls. C–F, tissue area (C), number of islets per pancreas (D), average islet area (E), and islet area as a percentage of pancreas area (F) were calculated from pancreas images (A). Data are mean ± S.E., t tests corrected for multiple comparisons; *, p < 0.05 versus chow-fed controls. G, pancreatic sections were stained with Ki67 as a measure of cell proliferation, and Ki67-positive islets were quantified. H, adipocytes within pancreatic slices were quantified. Data are mean ± S.E., t tests corrected for multiple comparisons; *, p < 0.05 versus chow-fed control, n = 4 mice per group with three sections per pancreas.
Figure 7.
Figure 7.
High-fat high-sucrose diet feeding switches islet responses to leptin. A, change in blood insulin concentration during the first 7.5 min of an i.p. GTT performed on mice fed chow (black bars) or HFHSD (white bars) for 60 weeks. Data were reanalyzed from Fig. 5G. Data are mean ± S.E., n = 8–9, Mann-Whitney with correction for multiple comparisons; *, p < 0.05 versus chow response. B–D, insulin secretion from primary islets isolated from mice fed chow or HFHSD for indicated times and incubated with 2, 11, or 20 mm glucose. Data from control mice and mice fed a HFHSD for 6 and 12 weeks (weeks) (B), 18, 24, and 32 weeks (C) were similar and so were combined for statistical power, whereas and data from control mice and mice fed a HFHSD for 60 weeks were analyzed as a single time point (D). Data are mean ± S.E., n = 19 at 6–12 weeks, 17 at 18–24 weeks, and 15 at 60 weeks; t tests corrected for multiple comparisons; *, p < 0.05 versus chow response at same glucose concentration. E, insulin secretion in response to 11 and 20 mm glucose was assessed in the presence of 20 ng/ml leptin. Percentage change in insulin secretion was calculated per mouse. Data are mean ± S.E., Wilcoxon signed-rank test to test for difference from 0, *, p < 0.05. n = 16 and 18 at 6–12 weeks; 23 and 18 at 18–32 weeks; 25 and 27 at 60 weeks for chow- and HSHFD-fed mice, respectively.

Similar articles

Cited by

References

    1. Reaven G. (2004) The metabolic syndrome or the insulin resistance syndrome? Different names, different concepts, and different goals. Endocrinol. Metab. Clin. North Am. 33, 283–303 10.1016/j.ecl.2004.03.002 - DOI - PubMed
    1. Buettner R., Schölmerich J., and Bollheimer L. C. (2007) High-fat diets: modeling the metabolic disorders of human obesity in rodents. Obesity 15, 798–808 10.1038/oby.2007.608 - DOI - PubMed
    1. Solon-Biet S. M., McMahon A. C., Ballard J. W., Ruohonen K., Wu L. E., Cogger V. C., Warren A., Huang X., Pichaud N., Melvin R. G., Gokarn R., Khalil M., Turner N., Cooney G. J., Sinclair D. A., et al. (2014) The ratio of macronutrients, not caloric intake, dictates cardiometabolic health, aging, and longevity in ad libitum-fed mice. Cell Metab. 19, 418–430 10.1016/j.cmet.2014.02.009 - DOI - PMC - PubMed
    1. Kahn S. E., Hull R. L., and Utzschneider K. M. (2006) Mechanisms linking obesity to insulin resistance and type 2 diabetes. Nature 444, 840–846 10.1038/nature05482 - DOI - PubMed
    1. Barclay J. L., Shostak A., Leliavski A., Tsang A. H., Jöhren O., Müller-Fielitz H., Landgraf D., Naujokat N., van der Horst G. T., and Oster H. (2013) High-fat diet-induced hyperinsulinemia and tissue-specific insulin resistance in Cry-deficient mice. Am. J. Physiol. Endocrinol. Metab. 304, E1053–E1063 10.1152/ajpendo.00512.2012 - DOI - PubMed

Publication types