. 2018 Apr 13;92(9):e00207-18.
doi: 10.1128/JVI.00207-18. Print 2018 May 1.

WDR5 Facilitates Human Cytomegalovirus Replication by Promoting Capsid Nuclear Egress

Affiliations

WDR5 Facilitates Human Cytomegalovirus Replication by Promoting Capsid Nuclear Egress

Bo Yang et al. J Virol. .

Abstract

WD repeat-containing protein 5 (WDR5) is essential for assembling the VISA-associated complex to induce a type I interferon antiviral response to Sendai virus infection. However, the roles of WDR5 in DNA virus infections are not well described. Here, we report that human cytomegalovirus exploits WDR5 to facilitate capsid nuclear egress. Overexpression of WDR5 in fibroblasts slightly enhanced the infectious virus yield. However, WDR5 knockdown dramatically reduced infectious virus titers with only a small decrease in viral genome replication or gene expression. Further investigation of late steps of viral replication found that WDR5 knockdown significantly impaired formation of the viral nuclear egress complex and induced substantially fewer infoldings of the inner nuclear membrane. In addition, fewer capsids were associated with these infoldings, and there were fewer capsids in the cytoplasm. Restoration of WDR5 partially reversed these effects. These results suggest that WDR5 knockdown impairs the nuclear egress of capsids, which in turn decreases virus titers. These findings reveal an important role for a host factor whose function(s) is usurped by a viral pathogen to promote efficient replication. Thus, WDR5 represents an interesting regulatory mechanism and a potential antiviral target.IMPORTANCE Human cytomegalovirus (HCMV) has a large (∼235-kb) genome with over 170 open reading frames and exploits numerous cellular factors to facilitate its replication. HCMV infection increases protein levels of WD repeat-containing protein 5 (WDR5) during infection, overexpression of WDR5 enhances viral replication, and knockdown of WDR5 dramatically attenuates viral replication. Our results indicate that WDR5 promotes the nuclear egress of viral capsids, the depletion of WDR5 resulting in a significant decrease in production of infectious virions. This is the first report that WDR5 favors HCMV, a DNA virus, replication and highlights a novel target for antiviral therapy.

Keywords: IINMs; WDR5; capsid; human cytomegalovirus; nuclear egress.


Figures

FIG 1
FIG 1
HCMV infection upregulates WDR5. HELs were mock infected (M) or infected with HSV-1 or HCMV (V) at an MOI of 3 and then harvested at 36 hpi (HSV-1) or the times indicated (HCMV). (A) Relative protein levels were determined from IBs of cell lysates that were probed for the indicated proteins; actin is a loading control. Protein levels relative to those in mock-infected controls were determined by densitometry and are indicated below each WDR5 blot. Representative images from three independent experiments are shown. (B) Total RNA was isolated, and the relative levels of WDR5 transcripts were determined by qRT-PCR; GAPDH is an internal control. Data were normalized to the levels in mock-infected cells to provide fold changes after HCMV infection. Data were analyzed by one-way ANOVA. *, P < 0.05; ***, P < 0.001. (C) HCMV-infected HELs were treated with cycloheximide (CHX; 100 μg/ml) at 72 hpi, and the levels of WDR5 were determined by IB at 4-h intervals after CHX addition and normalized to the levels measured at 0 h. Representative images from three independent experiments are shown (top); relative levels are presented as means ± SDs (bottom). Data were analyzed by one-way ANOVA. ***, P < 0.001. (D) At 72 hpi, HCMV-infected HELs were treated with DMSO (−) or MG132 (6 μM) (+) and then harvested 8 h later and analyzed to determine the extent of WDR5 ubiquitination by immunoprecipitation (IP) with WDR5 antibody followed by IB with antiubiquitin antibody (right). The levels of ubiquitinated proteins or specific proteins were determined by probing the IBs of input samples with antiubiquitin (Ub) antibody or antibodies to the indicated proteins (left).
FIG 2
FIG 2
WDR5 overexpression enhances HCMV genome replication, viral gene expression, and infectious virus yield. HELFs were transduced with lentiviruses designed to overexpress WDR5 (OE) or the empty vector control (NC) and then infected with HCMV or HSV-1 at the indicated MOIs. Infected cells and culture supernatants were collected at the times indicated and analyzed to determine viral genome copy number, viral protein level, and infectious virus titers. (A) Viral genome replication. The HCMV genome copy number was determined by qPCR and normalized to the amount of cellular DNA (GAPDH). Results are shown as means ± SDs. (B) IB was used to determine relative WDR5 or viral protein levels in cell lysates. Representative images from three independent experiments are shown. (C) Growth kinetics of viral infection. NC and OE cells were infected with HCMV at an MOI of 3 (left) or 0.5 (middle) or HSV-1 at an MOI of 3 (right). Supernatant samples were collected at the indicated times postinfection, and infectious virus was titrated by a plaque formation assay. The average results from three independent ones are shown. Significance was analyzed by one-way ANOVA. *, P < 0.05; **, P < 0.01; ***, P < 0.001.
FIG 3
FIG 3
Knockdown of WDR5 suppresses HCMV replication. (A) Efficiency of WDR5 knockdown. HELFs were transduced with lentiviruses expressing scrambled shRNA (sh-Scram) or three WDR5-specific shRNAs (sh-W1, sh-W2, sh-W3), and WDR5 levels were examined by IB at 48 h postransduction. WDR5 levels relative to those in sh-Scram-transduced cells are listed below each blot. (B) WDR5 protein level in the established cell lines. WDR5 levels in stable cell lines derived from HELFs transduced with sh-Scram (Ctl cells) or sh-W3 (KD cells) or KD cells transduced with WDR5-expressing lentivirus (Rec cells) were examined by IB. WDR5 levels relative to those in Ctl cells (after normalization to the actin level) are listed below the corresponding blots. (C) Cell viability. The viability of cells of the Ctl, KD, and Rec cell lines were determined by MTT assay. Data were from three independent experiments and were analyzed by one-way ANOVA followed by the Bonferroni post hoc test. Results are presented as means ± SDs. NS, not significant. (D) Growth kinetics of viruses. Ctl, KD, or Rec cells were infected with HCMV or HSV-1 at the indicated MOIs. Culture supernatants were collected at the indicated times postinfection, and infectious virus titers were determined by a plaque formation assay. Data were collected from three independent experiments, performed in triplicate, and analyzed by one-way ANOVA (right). Results are presented as means ± SDs. **, P < 0.01; ***, P < 0.001. When a comparison among experimental groups was needed (left and middle), the Bonferroni post hoc test was conducted for multiple-test corrections. **, P < 0.0033; ***, P < 0.0003.
FIG 4
FIG 4
Effect of WDR5 knockdown on viral entry, genome replication, and viral gene expression. Ctl, KD, or Rec cells were mock infected (M) or infected with HCMV (V) at the indicated MOIs. Cells were harvested or fixed at the indicated times postinfection and processed for determination of viral entry, viral genome replication, or viral gene expression. (A) Viral entry determined by input pp65 levels. Cells were harvested at 1 hpi and analyzed by IB to detect pp65. Protein levels were quantified by densitometry, normalized to the amount of actin, and compared to the corresponding levels in Ctl cells. WDR5 and pp65 protein levels relative to those in Ctl cells are listed below the corresponding blots. (B) Viral entry determined by IE1 expression. Ctl, KD, or Rec cells on coverslips were infected with HCMV at an MOI of 1 and fixed at 12 hpi. HCMV IE1 protein (red) was detected by IFA, and nuclei were counterstained with DAPI (blue). Total cells and IE1-positive cells were counted in 20 random fields selected from each experiment. Data were analyzed by one-way ANOVA followed by the Bonferroni post hoc test. Representative images (left) and quantifications (right) are shown. Results are medians ± SDs. NS, not significant. (C) Viral genome level. HCMV-infected Ctl, KD, and Rec cells were assessed for the HCMV genome copy number at the indicated times postinfection by qPCR. Data were analyzed by one-way ANOVA followed by the Bonferroni post hoc test. Results are shown as means ± SDs. *, P < 0.0167; ***, P < 0.0003. (D) Viral protein level. HCMV-infected Ctl, KD, and Rec cells were collected at the indicated times postinfection, and cell lysates were subjected to IB to detect the indicated proteins. Representative images from three independent experiments are shown.
FIG 5
FIG 5
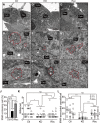
Knockdown of WDR5 does not affect capsid formation. Ctl cells (A and B), KD cells (C and D), or Rec cells (E and F) were infected with HCMV at an MOI of 0.5 and fixed at 96 hpi for analysis by TEM. To evaluate the formation of capsids in the nuclei, capsid quantification and analysis were performed. Cell sections were captured at a magnification of ×1,700 (A, C, and E), and the boxed regions were enlarged to a magnification of ×9,600 (B, D, and F) to show the capsids. Cyto, cytoplasm; Nuc, nucleus. (G) For each experiment, the total numbers of A, B, or C capsids per cell were quantitated. (H) The prevalence of A, B, and C capsids in each cell type was calculated as the percentage of the total number of capsids per cell. (I) Capsids that localized outside of NRCs (B, D, and F, white arrows) were counted in 12 nuclei of each cell type. Data were collected from three independent experiments and analyzed by the Kruskal-Wallis test. The medians from each experiment are indicated, and their values are shown to the right of each plot. The means from the three experiments are shown above the data for each cell line. NS, not significant.
FIG 6
FIG 6
Knockdown of WDR5 affects capsid nuclear egress by impairing NEC formation. Ctl, KD, or Rec cells were infected with HCMV at an MOI of 1, and the cells were fixed at the indicated times for IFA. (A) MCP (cyan) and pUL53 (red) were determined by IFA, and nuclei were counterstained with DAPI (blue). Representative images from three independent experiments are shown. (B) Cells staining positive for MCP or pUL53 were counted in 20 random fields. The percentages of pUL53-positive cells among MCP-positive populations during the course of HCMV infection are shown. Data from three independent experiments were analyzed by one-way ANOVA followed by the Bonferroni post hoc test. The results are presented as the means ± SDs. NS, not significant; *, P < 0.0167; **, P < 0.0033; ***, P < 0.0003. (C) Average numbers of pUL53 puncta per nuclear rim at 120 hpi in Ctl, KD, or Rec cells. Data were collected from three independent experiments and analyzed by the Kruskal-Wallis test followed by post hoc Dunn's multiple-comparison test. The medians from each experiment are indicated to the right of each plot, and the means from the three experiments for each cell line are shown above the data. NS, not significant; ***, P < 0.001.
FIG 7
FIG 7
pUL50 and pUL53 colocalize in transfected Ctl, KD, or Rec cells. Uninfected Ctl, KD, or Rec cells were transiently transfected with plasmids carrying UL50-DsRed or hemagglutinin (HA)-UL53. Cells were fixed at 48 h posttransfection and stained with a mouse antihemagglutinin primary antibody, followed by Alexa Fluor 488-conjugated goat anti-mouse immunoglobulin secondary antibody (green). Nuclei were counterstained with DAPI (blue). Cells in the upper two rows were transfected with each plasmid independently, while cells in the next three rows were cotransfected with both plasmids simultaneously. Areas magnified in the bottom panels are framed by boxes in the panels above. Bars, 10 μm.
FIG 8
FIG 8
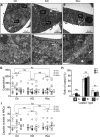
Knockdown of WDR5 impairs formation of IINM. Ctl (A to C), KD (D to F), or Rec (G to I) cells were infected with HCMV at an MOI of 0.5 and then fixed at 120 hpi for TEM. Micrographs were captured at a magnification of ×1,700 (A, D, and G), while the boxed regions are enlarged to a magnification of ×3,500 (E) or ×6,800 (B, C, F, H, and I). IINMs are delineated by dotted red lines. (J) For each experiment, 12 cells with identifiable nuclei were randomly selected to calculate the percentages of cells containing IINMs. (K and L) The numbers of IINMs per cell (K) and the numbers of IINM-associated capsids per cell (L) were determined for each cell type. Data were collected from three independent experiments and analyzed by the Kruskal-Wallis test followed by post hoc Dunn's multiple-comparison test. The medians for each experiment are indicated to the right of each plot, and the means from the three experiments for each cell line are shown above the data. NS, not significant; *, P < 0.05; ***, P < 0.001.
FIG 9
FIG 9
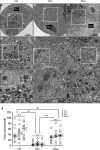
Knockdown of WDR5 decreases the number of cytoplasmic virions. Ctl (A to C), KD (D to F), or Rec (G to I) cells were infected with HCMV at an MOI of 0.5 and fixed at 120 hpi for analysis by TEM. Sections were captured at a magnification of ×1,700 (A, D, and G), and cytoplasmic compartments containing virus particles were captured at magnifications of ×3,500 (B, E, and H) and ×6,800 (C, F, and I). For each experiment, cytoplasmic virus particles located within virus assembly compartments were quantified in 10 cells. Representative images (A to I) and quantitations (J) are shown. The medians from each experiment are indicated to the right of each plot, and the medians from the three experiments for each cell line are shown above the data. Data were collected from three independent experiments and analyzed by the Kruskal-Wallis test followed by post hoc Dunn's multiple-comparison test. NS, not significant; ***, P < 0.001.

Similar articles

Cited by

References

    1. Karlin S, Mocarski ES, Schachtel GA. 1994. Molecular evolution of herpesviruses: genomic and protein sequence comparisons. J Virol 68:1886–1902. - PMC - PubMed
    1. Davison AJ. 2002. Evolution of the herpesviruses. Vet Microbiol 86:69–88. doi:10.1016/S0378-1135(01)00492-8. - DOI - PubMed
    1. Swanson EC, Schleiss MR. 2013. Congenital cytomegalovirus infection: new prospects for prevention and therapy. Pediatr Clin North Am 60:335–349. doi:10.1016/j.pcl.2012.12.008. - DOI - PMC - PubMed
    1. Manicklal S, Emery VC, Lazzarotto T, Boppana SB, Gupta RK. 2013. The “silent” global burden of congenital cytomegalovirus. Clin Microbiol Rev 26:86–102. doi:10.1128/CMR.00062-12. - DOI - PMC - PubMed
    1. Cobbs CS, Harkins L, Samanta M, Gillespie GY, Bharara S, King PH, Nabors LB, Cobbs CG, Britt WJ. 2002. Human cytomegalovirus infection and expression in human malignant glioma. Cancer Res 62:3347–3350. - PubMed

Publication types

MeSH terms

Substances

LinkOut - more resources