

Structural tract alterations predict downstream tau accumulation in amyloid-positive older individuals
- PMID: 29403032
- PMCID: PMC5857215
- DOI: 10.1038/s41593-018-0070-z
Structural tract alterations predict downstream tau accumulation in amyloid-positive older individuals
Abstract
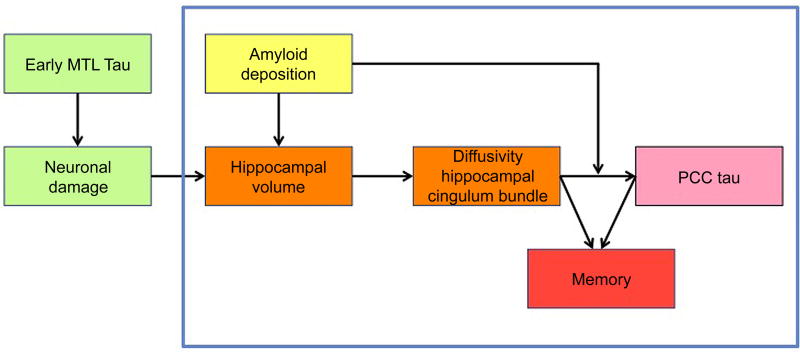
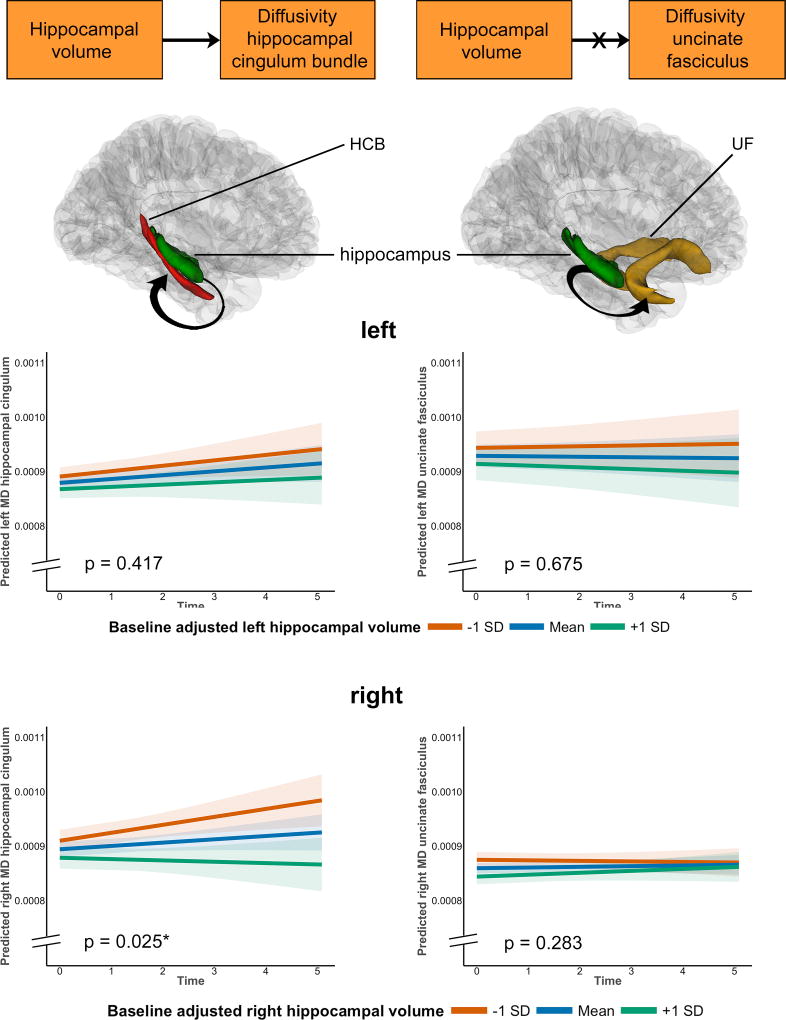
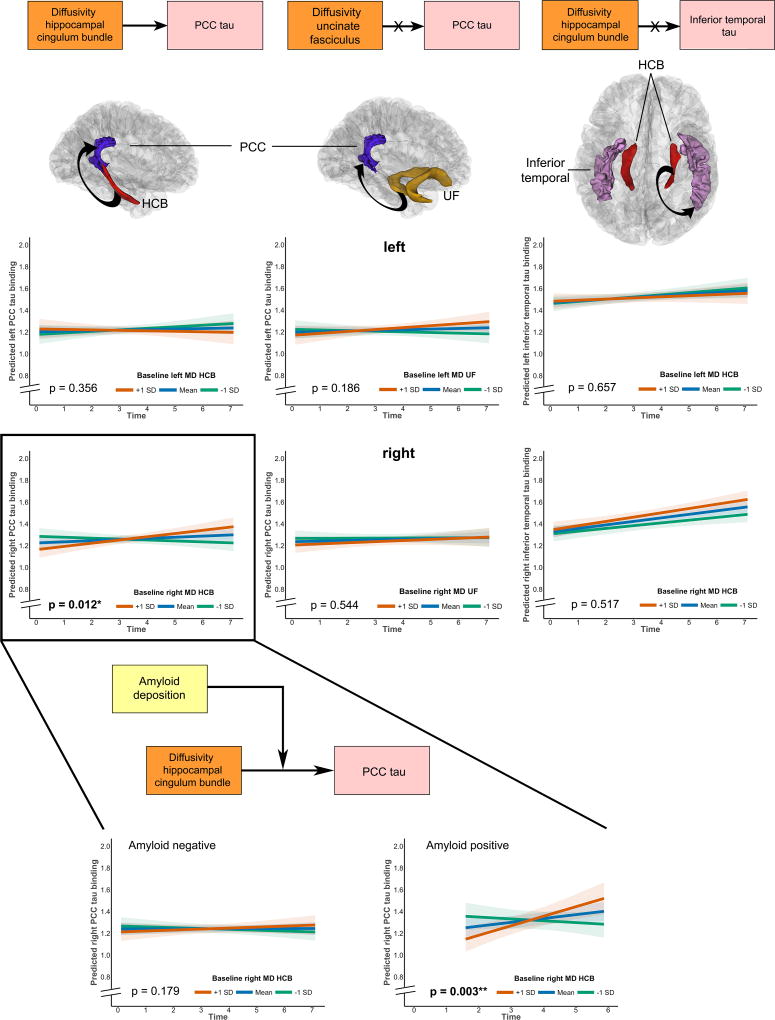
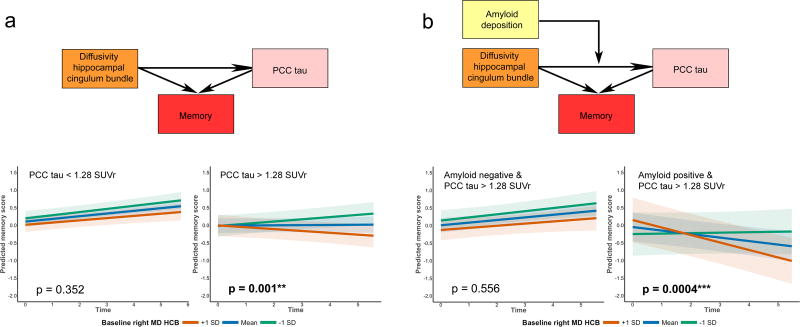
Animal models of Alzheimer's disease have suggested that tau pathology propagation, facilitated by amyloid pathology, may occur along connected pathways. To investigate these ideas in humans, we combined amyloid scans with longitudinal data on white matter connectivity, hippocampal volume, tau positron emission tomography and memory performance in 256 cognitively healthy older individuals. Lower baseline hippocampal volume was associated with increased mean diffusivity of the connecting hippocampal cingulum bundle (HCB). HCB diffusivity predicted tau accumulation in the downstream-connected posterior cingulate cortex in amyloid-positive but not in amyloid-negative individuals. Furthermore, HCB diffusivity predicted memory decline in amyloid-positive individuals with high posterior cingulate cortex tau binding. Our results provide in vivo evidence that higher amyloid pathology strengthens the association between HCB diffusivity and tau accumulation in the downstream posterior cingulate cortex and facilitates memory decline. This confirms amyloid's crucial role in potentiating neural vulnerability and memory decline marking the onset of preclinical Alzheimer's disease.
Figures
Comment in
-
Following the pathway to Alzheimer's disease.Nat Neurosci. 2018 Mar;21(3):306-308. doi: 10.1038/s41593-018-0085-5. Nat Neurosci. 2018. PMID: 29476126 No abstract available.
Similar articles
-
Association of deposition of tau and amyloid-β proteins with structural connectivity changes in cognitively normal older adults and Alzheimer's disease spectrum patients.Brain Behav. 2018 Dec;8(12):e01145. doi: 10.1002/brb3.1145. Epub 2018 Oct 24. Brain Behav. 2018. PMID: 30358161 Free PMC article.
-
Entorhinal Tau Pathology, Episodic Memory Decline, and Neurodegeneration in Aging.J Neurosci. 2018 Jan 17;38(3):530-543. doi: 10.1523/JNEUROSCI.2028-17.2017. Epub 2017 Nov 30. J Neurosci. 2018. PMID: 29192126 Free PMC article.
-
Tau Accumulation in Clinically Normal Older Adults Is Associated with Hippocampal Hyperactivity.J Neurosci. 2019 Jan 16;39(3):548-556. doi: 10.1523/JNEUROSCI.1397-18.2018. Epub 2018 Nov 27. J Neurosci. 2019. PMID: 30482786 Free PMC article.
-
Hippocampal Connectivity with Retrosplenial Cortex is Linked to Neocortical Tau Accumulation and Memory Function.J Neurosci. 2021 Oct 20;41(42):8839-8847. doi: 10.1523/JNEUROSCI.0990-21.2021. Epub 2021 Sep 16. J Neurosci. 2021. PMID: 34531286 Free PMC article.
-
The Effects of Amyloid and Tau on Functional Network Connectivity in Older Populations.Brain Connect. 2021 Oct;11(8):599-612. doi: 10.1089/brain.2020.0902. Epub 2021 May 17. Brain Connect. 2021. PMID: 33813858 Review.
Cited by
-
Bundle-specific associations between white matter microstructure and Aβ and tau pathology in preclinical Alzheimer's disease.Elife. 2021 May 13;10:e62929. doi: 10.7554/eLife.62929. Elife. 2021. PMID: 33983116 Free PMC article.
-
Synergy between amyloid-β and tau in Alzheimer's disease.Nat Neurosci. 2020 Oct;23(10):1183-1193. doi: 10.1038/s41593-020-0687-6. Epub 2020 Aug 10. Nat Neurosci. 2020. PMID: 32778792 Free PMC article. Review.
-
State-of-the-art imaging of neuromodulatory subcortical systems in aging and Alzheimer's disease: Challenges and opportunities.Neurosci Biobehav Rev. 2023 Jan;144:104998. doi: 10.1016/j.neubiorev.2022.104998. Epub 2022 Dec 13. Neurosci Biobehav Rev. 2023. PMID: 36526031 Free PMC article. Review.
-
Synaptic distributions of pS214-tau in rhesus monkey prefrontal cortex are associated with spine density, but not with cognitive decline.J Comp Neurol. 2019 Mar 1;527(4):856-873. doi: 10.1002/cne.24576. Epub 2018 Dec 4. J Comp Neurol. 2019. PMID: 30408169 Free PMC article.
-
Spread of pathological tau proteins through communicating neurons in human Alzheimer's disease.Nat Commun. 2020 May 26;11(1):2612. doi: 10.1038/s41467-020-15701-2. Nat Commun. 2020. PMID: 32457389 Free PMC article.
References
-
- Braak H, Braak E. Neuropathological stageing of Alzheimer-related changes. Acta Neuropathol. 1991;82:239–259. - PubMed
-
- Braak H, Braak E. Development of Alzheimer-related neurofibrillary changes in the neocortex inversely recapitulates cortical myelogenesis. Acta Neuropathol. 1996;92:197–201. - PubMed
-
- Hu W, et al. Hyperphosphorylation determines both the spread and the morphology of tau pathology. Alzheimers Dement. 2016;12:1066–1077. - PubMed
Publication types
MeSH terms
Substances
Grants and funding
- P41 EB022544/EB/NIBIB NIH HHS/United States
- K24 AG035007/AG/NIA NIH HHS/United States
- R01 AG037497/AG/NIA NIH HHS/United States
- S10 RR021110/RR/NCRR NIH HHS/United States
- S10 RR019307/RR/NCRR NIH HHS/United States
- R01 AG027435/AG/NIA NIH HHS/United States
- P50 AG005134/AG/NIA NIH HHS/United States
- R01 AG034556/AG/NIA NIH HHS/United States
- R01 EB014894/EB/NIBIB NIH HHS/United States
- R01 AG046396/AG/NIA NIH HHS/United States
- R01 AG026484/AG/NIA NIH HHS/United States
- R01 AG053509/AG/NIA NIH HHS/United States
- U01 AG032438/AG/NIA NIH HHS/United States
- P01 AG036694/AG/NIA NIH HHS/United States
- U01 AG024904/AG/NIA NIH HHS/United States
- U19 AG024904/AG/NIA NIH HHS/United States
- K23 EB019023/EB/NIBIB NIH HHS/United States
- K23 AG053422/AG/NIA NIH HHS/United States
- R21 AG038994/AG/NIA NIH HHS/United States
- S10 OD010364/OD/NIH HHS/United States
- U01 AG010483/AG/NIA NIH HHS/United States
- S10 RR023043/RR/NCRR NIH HHS/United States
- K01 AG040197/AG/NIA NIH HHS/United States
- P41 EB015896/EB/NIBIB NIH HHS/United States
- U19 AG032438/AG/NIA NIH HHS/United States
- S10 RR023401/RR/NCRR NIH HHS/United States
LinkOut - more resources
Full Text Sources
Other Literature Sources
