. 2018 Mar;24(3):292-303.
doi: 10.1038/nm.4481. Epub 2018 Feb 5.

Brown adipose tissue thermogenic adaptation requires Nrf1-mediated proteasomal activity

Affiliations

Brown adipose tissue thermogenic adaptation requires Nrf1-mediated proteasomal activity

Alexander Bartelt et al. Nat Med. 2018 Mar.

Abstract

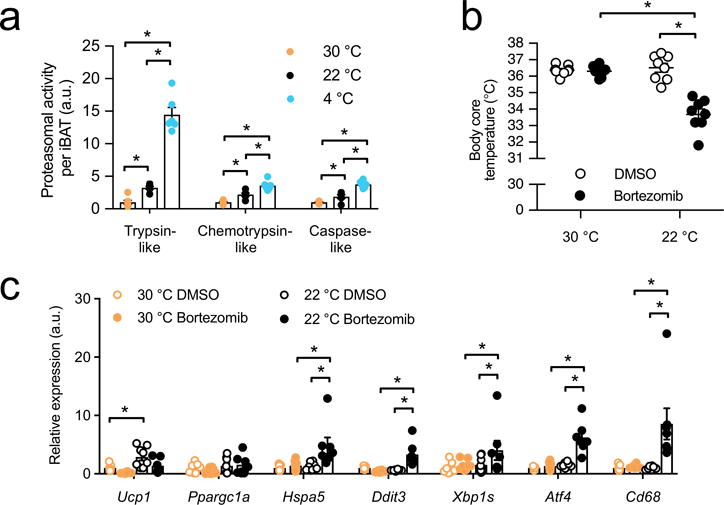
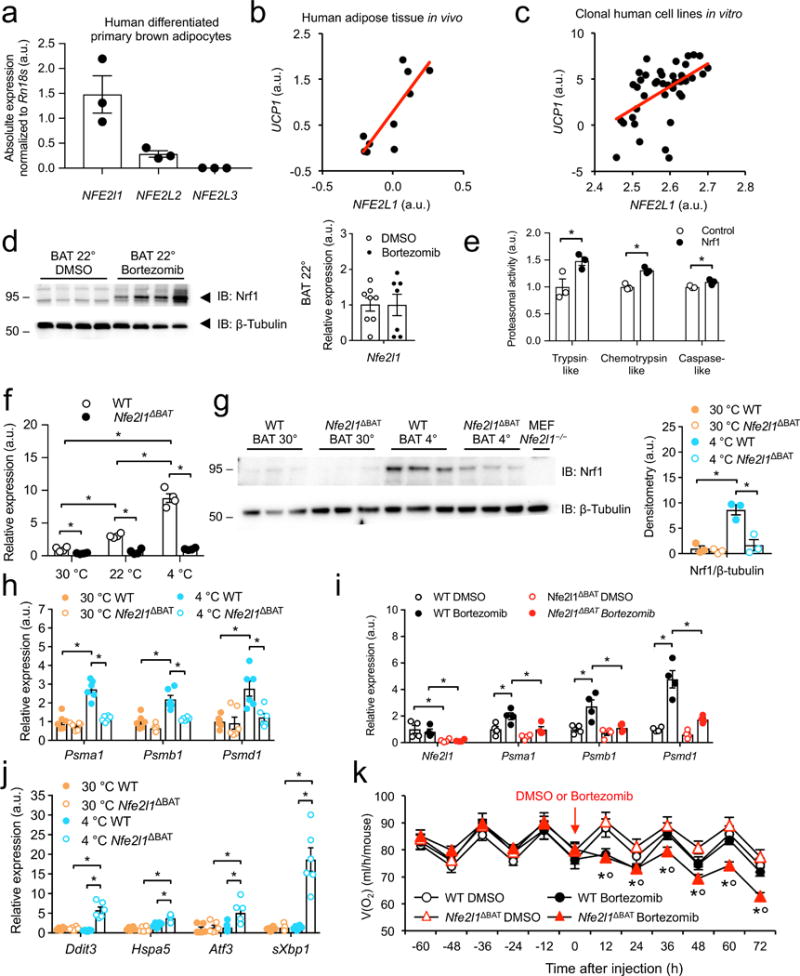
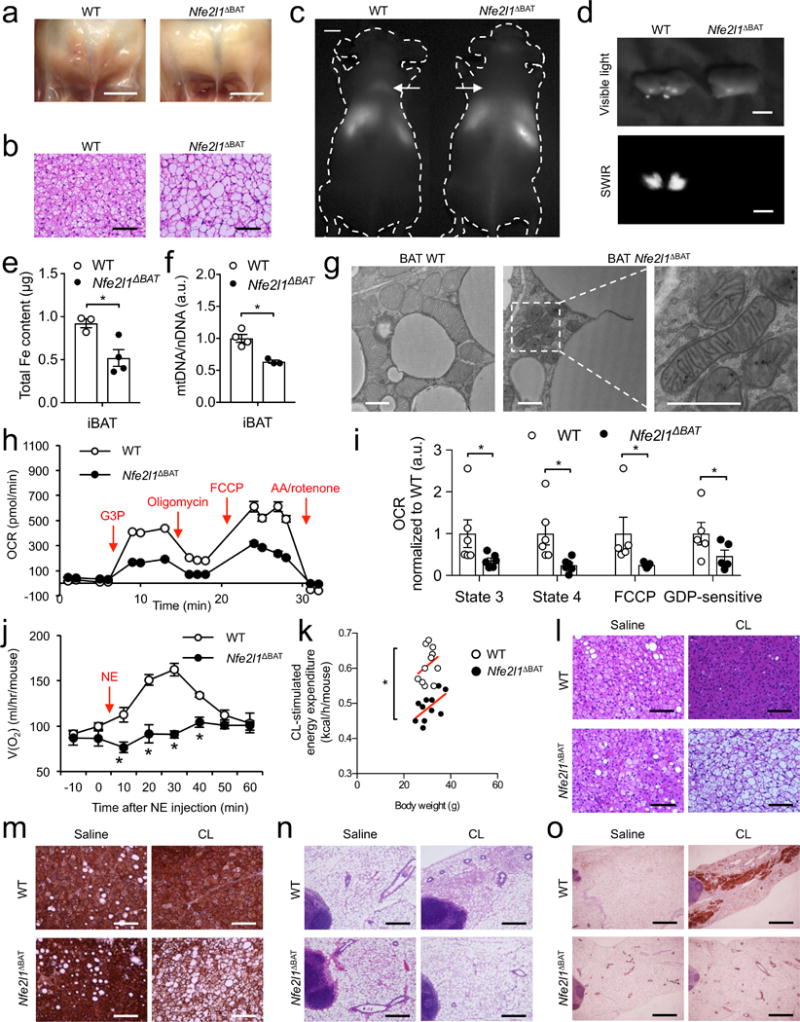
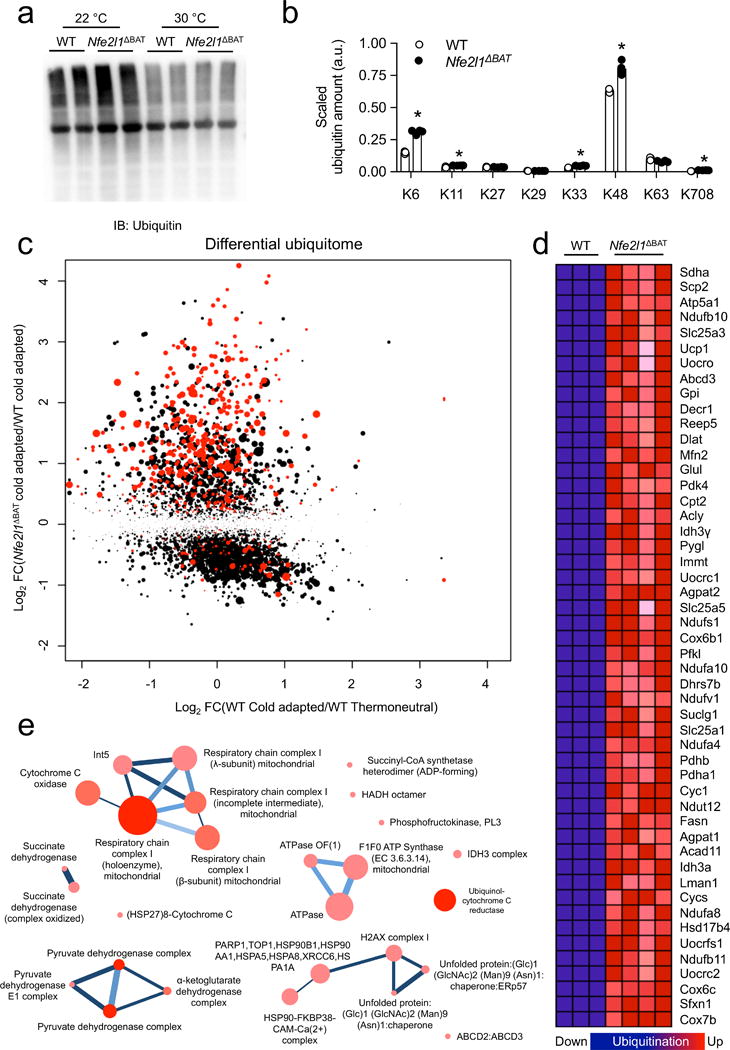
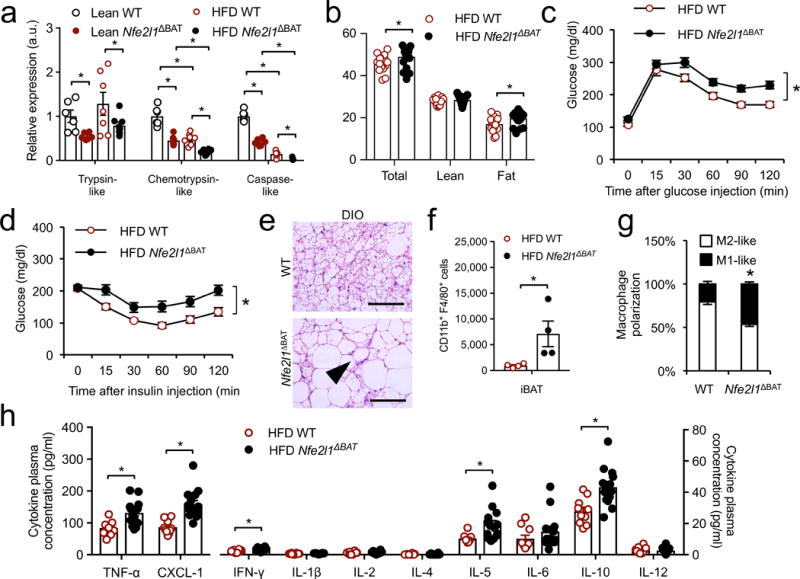
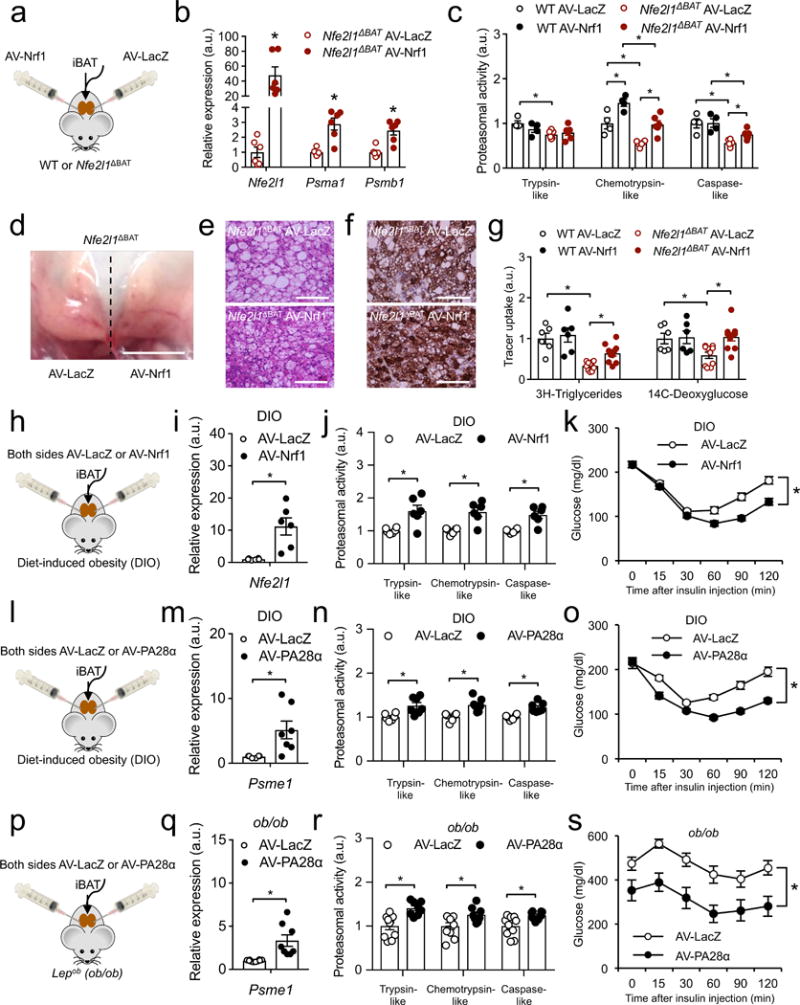
Adipocytes possess remarkable adaptive capacity to respond to nutrient excess, fasting or cold exposure, and they are thus an important cell type for the maintenance of proper metabolic health. Although the endoplasmic reticulum (ER) is a critical organelle for cellular homeostasis, the mechanisms that mediate adaptation of the ER to metabolic challenges in adipocytes are unclear. Here we show that brown adipose tissue (BAT) thermogenic function requires an adaptive increase in proteasomal activity to secure cellular protein quality control, and we identify the ER-localized transcription factor nuclear factor erythroid 2-like 1 (Nfe2l1, also known as Nrf1) as a critical driver of this process. We show that cold adaptation induces Nrf1 in BAT to increase proteasomal activity and that this is crucial for maintaining ER homeostasis and cellular integrity, specifically when the cells are in a state of high thermogenic activity. In mice, under thermogenic conditions, brown-adipocyte-specific deletion of Nfe2l1 (Nrf1) resulted in ER stress, tissue inflammation, markedly diminished mitochondrial function and whitening of the BAT. In mouse models of both genetic and dietary obesity, stimulation of proteasomal activity by exogenously expressing Nrf1 or by treatment with the proteasome activator PA28α in BAT resulted in improved insulin sensitivity. In conclusion, Nrf1 emerges as a novel guardian of brown adipocyte function, providing increased proteometabolic quality control for adapting to cold or to obesity.


Conflict of interest statement

Competing Interests

The authors declare no competing interest. The study was supported by an industry-sponsored research agreement between Harvard University and Servier.

Figures

Figure 1
Figure 1
Proteasomal activity is induced during cold adaptation and is required for non-shivering thermogenesis in BAT. (a) Proteasome activity per total interscapular BAT (iBAT) from wild-type (WT) mice after adaptation to thermoneutrality (30 °C), room temperature (22 °C) or cold (4 °C) for 7 days (Biol. replicates n = 6, *P < 0.05 by 1-way ANOVA). (b) Body core temperature after 16 h bortezomib (2.5 mg/kg) or control dimethyl sulfoxide (DMSO) treatment in WT mice housed at 22 °C or 30 °C (biol. replicates n = 8, *P < 0.05 by 2-way ANOVA). (c) mRNA levels of brown fat activation and stress markers in BAT of WT mice housed at 22 °C or 30 °C 16 h after bortezomib (2.5 mg/kg) or control DMSO treatment in (Biol. replicates n = 7 for 30 °C DMSO and 22 °C bortezomib and n = 8 for 22°C DMSO and 30°C bortezomib, normalized by ΔCT, *P < 0.05 by 2-way ANOVA).
Figure 2
Figure 2
Nrf1 is a cold-inducible regulator of proteasome function in brown fat. (a) NFE2L1 gene expression in human differentiated primary brown adipocytes (Biol. replicates n = 3) (b) Human adipose tissue biopsy NFE2L1 gene expression correlated to UCP1 (Black circles represent individual subjects, biol. replicates n = 10; Spearman correlation: r = 0.08, P = 0.00469). (c) NFE2L1 gene expression in clonal cell lines derived from human adipose tissue correlated to UCP1 (Black circles represent individual clones, biol. replicates n = 42; Spearman correlation: r = 0.528, P = 0.00039). (d) Representative immunoblot of Nrf1 and Nfe2l1 mRNA levels in BAT after 16 h bortezomib (2.5 mg/kg) or DMSO treatment (Blot: biol. replicates n = 4, cropped images; mRNA: 22 °C, biol. replicates n = 8 for DMSO and n = 7 for bortezomib treatment, normalized by ΔCT). (e) Proteasomal activity in Nrf1-overexpressing and control brown adipocytes (Biol. replicates n = 3, *P < 0.05 by T-Test). (f,g) Nfe2l1 mRNA levels and representative immunoblot of Nrf1 after 7 days adaptation to 4 °C in BAT from WT mice or mice lacking Nrf1 in brown adipocytes (Nfe2l1ΔBAT; biol. replicates n = 4 in (f) and n = 3 in (g), normalized to Tbp, *P < 0.05 by 2-way ANOVA, cropped images). (h) mRNA levels of proteasome subunits expression in BAT of WT or Nfe2l1ΔBAT mice adapted to 4°C or 30 °C (Biol. replicates n = 6, normalized to Tbp, *P < 0.05 effect by 2-way ANOVA). (i) mRNA levels of proteasome subunits in BAT of WT or Nfe2l1ΔBAT mice after 16 h bortezomib (2.5 mg/kg) or DMSO treatment (22 °C; biol. replicates n = 4, normalized to Rn18s, *P < 0.05 by 2-way ANOVA). (j) mRNA levels of stress markers in BAT of WT or Nfe2l1ΔBAT mice adapted to 4 °C or 30 °C (Biol. replicates n=6, normalized to Tbp, *P < 0.05 by 2-way ANOVA). (k) Whole body oxygen consumption in WT or Nfe2l1ΔBAT mice treated with Bortezomib (1.25 mg/kg) or DMSO (22 °C, biol. replicates n = 8, *P < 0.05 by 2-way ANOVA).
Figure 3
Figure 3
Nrf1 is a fundamental regulator of BAT adaptation. (a) Photographs of iBAT (Scale bars, 5 mm) and (b) Hematoxylin & Eosin (H&E)-stained histology (Scale bars, 100 μm) of WT and Nfe2l1ΔBAT mice at 22 °C. (c) Short-wave infrared (SWIR) imaging of WT mice and Nfe2l1ΔBAT. Arrows indicate interscapular BAT (d) Ex vivo SWIR and visible light imaging of iBAT from (c) (Scale bars in c,d, 5 mm). (e) Iron and (f) mitochondrial DNA content in iBAT of WT and Nfe2l1ΔBAT mice at 22 °C (Biol. replicates (e) n = 3 for WT and n = 4 for Nfe2l1ΔBAT and (f) n = 4 for WT and n = 3 for Nfe2l1ΔBAT, *P < 0.05 by Student’s t-Test). (g) Representative electron microscopy of iBAT of WT and Nfe2l1ΔBAT mice at 22 °C (biol. replicates n = 3, Scale bars, 1 μm) (h) Oxygen consumption rate (OCR) in mitochondria isolated from WT and Nfe2l1ΔBAT mice at 22 °C (G3P: Glycerol-3-phosphate, FCCP: Carbonyl cyanide-4-(trifluoromethoxy)phenylhydrazone, AA: Antimycin A; representative traces) (i) State 3, state 4, FCCP-induced and GDP-sensitive OCR in mitochondria isolated from WT and Nfe2l1ΔBAT mice at 22 °C (Biol. replicates n = 6 for state 3 and state 4, n = 5 for FCCP and GDP, *P < 0.05 by Mann-Whitney-U rank test). (j) Norepinephrine (NE)-stimulated whole-body oxygen consumption in WT and Nfe2l1ΔBAT mice at 22 °C (Biol. replicates n = 4, *P < 0.05 by Student’s t-Test). (k) CL316,243 (CL)-stimulated whole-body energy expenditure in WT and Nfe2l1ΔBAT mice at 22 °C (Biol. replicates n = 8, *P < 0.05 by T-Test). (l-o) Representative H&E histology (l) and Ucp1 immunohistochemistry (IHC) (m) of iBAT as well as H&E histology (n) and Ucp1 IHC (o) of inguinal white adipose tissue from WT and Nfe2l1ΔBAT mice at 30 °C treated with CL or saline (Biol. replicates n = 4. Scale bars in l,m, 100 μm; in n, 0.4 mm; in o, 1 mm).
Figure 4
Figure 4
The brown fat ubiquitome. (a) Representative immunoblot of ubiquitin in BAT from WT and Nfe2l1ΔBAT mice born and raised at 22 °C or 30 °C (Biol. replicates n=2, cropped image). (b) Proteomic quantification of ubiquitin lysine (K)-linkages in BAT from cold-adapted (4 °C for 7 days) WT and Nfe2l1ΔBAT mice (Biol. replicates WT n = 3, Nfe2l1ΔBAT n = 4, *P < 0.05 by Student’s t-Test). (c) Scatter plot of differentially ubiquitinated protein lysine site (FC: fold change) in BAT from thermoneutral or cold-adapted WT as well as cold-adapted Nfe2l1ΔBAT mice (Biol. replicates. n = 3 for WT 30 °C, n = 3 for WT 4 °C and n = 4 for 4 °C Nfe2l1ΔBAT mice; Significance cold-adapted WT vs Nfe2l1ΔBAT mice is indicated, higher significance indicated by larger dot size, red colour indicates mitocarta protein) (d) List of top 50 hyperubiquitinated proteins in BAT from cold-adapted Nfe2l1ΔBAT mice compared to cold-adapted WT. (e) Functional protein complex prediction of hyperubiquitinated proteins in Nfe2l1ΔBAT mice.
Figure 5
Figure 5
Nrf1-mediated proteasomal activity is linked to obesity-associated disorders. (a) Proteasomal activity in lean and high-fat diet (HFD) WT and Nfe2l1ΔBAT mice. (Biol. replicates n = 8, *P < 0.05 by 2-way ANOVA). (b) Body weight and composition of Nfe2l1ΔBAT mice and WT controls after HFD feeding (Biol. replicates WT n = 15, Nfe2l1ΔBAT n = 21, *P < 0.05 by Student’s t-Test). (c) Glucose tolerance test (1 g/kg) in HFD-fed WT and Nfe2l1ΔBAT mice (Biol. replicates WT n = 9, Nfe2l1ΔBAT n = 14, *P < 0.05 area under the curve different by Student’s t-Test). (d) Insulin tolerance test (1 U/kg) in HFD-fed WT and Nfe2l1ΔBAT mice (Biol. replicates WT n = 11, Nfe2l1ΔBAT n = 16, *P < 0.05 area under the curve different by Student’s t-Test). (e) Representative H&E histology of BAT from HFD-fed WT and Nfe2l1ΔBAT mice (Biol. replicates n = 15; Scale bars, 100 μm, arrow indicating crown-like structure). (f,g) Fluorescent flow cytometery quantification of (f) total macrophage content and (g) macrophage polarization in BAT from HFD-fed WT and Nfe2l1ΔBAT mice (Biol. replicates n = 4, *P < 0.05 by Student’s t-Test). (h) Cytokine plasma concentrations from HFD-fed WT and Nfe2l1ΔBAT mice. (Biol. replicates n = 10 for WT, n = 14 for Nfe2l1ΔBAT, *P < 0.05 by Student’s t-Test).
Figure 6
Figure 6
Enhancing proteostasis in BAT alleviates insulin resistance in DIO and ob/ob mice. (a) Strategy for contralateral intraBAT injection of adenovirus carrying LacZ (AV-LacZ) and Nrf1 (AV-Nrf1) into WT and Nfe2l1ΔBAT mice at 22 °C. (b) mRNA levels of Nfe2l1 and proteasome subunits in BAT of Nfe2l1ΔBAT mice BAT-injected with AV-LacZ and AV-Nrf1 (Biol. replicates n = 6, normalized to 18s, *P < 0.05 by Student’s t-Test). (c) Proteasome activity in WT and Nfe2l1ΔBAT mice BAT-injected with AV-LacZ and AV-Nrf1 (Biol. replicates n = 4 for WT and n = 6 for Nfe2l1ΔBAT, *P < 0.05 by 2-way ANOVA). (d) Photograph of iBAT of a Nfe2l1ΔBAT mouse injected with AV-LacZ (left) and AV-Nrf1 (right) contralaterally (Scale bar, 5 mm). (e) Representative H&E histology and (f) Ucp1 IHC of Nfe2l1ΔBAT mice injected with AV-LacZ and AV-Nrf1 (Biol. replicates n = 3; Scale bars, 100 μm). (g) BAT uptake of radiolabelled tracers after a combined oral fat and glucose tolerance test in WT and Nfe2l1ΔBAT mice injected with AV-LacZ and AV-Nrf1 (Biol. replicates n = 6 for WT and n = 10 for Nfe2l1ΔBAT, *P < 0.05 by 2-way ANOVA. (h) Strategy for intraBAT injection of AV-LacZ or AV-Nrf1 into diet-induced obese (DIO) mice. (i) mRNA levels of Nfe2l1 in BAT of DIO mice BAT-injected with AV-LacZ or AV-Nrf1 (Biol. replicates n = 6, normalized to Tbp, *P < 0.05 by Student’s t-Test). (j) Proteasome activity in DIO mice BAT-injected with AV-LacZ or AV-Nrf1 (biol. replicates n = 6, *P < 0.05 by Student’s t-Test). (k) Insulin tolerance test in DIO mice BAT-injected with AV-LacZ or AV-Nrf1 (Biol. replicates n = 10, *P < 0.05 by Student’s t-Test on AUC). (l) Strategy for intraBAT injection of AV-LacZ or AV-PA28α into diet-induced obese (DIO) mice. (m) mRNA levels of PA28α (encoded by Psme1) in BAT of DIO mice BAT-injected with AV-LacZ or AV-PA28α (Biol. replicates n = 6 for AV-LacZ and n = 7 for AV-PA28α, normalized to Tbp, *P < 0.05 by Student’s t-Test). (n) Proteasome activity in DIO mice BAT-injected with AV-LacZ or AV-PA28α (Biol. replicates n = 6 for AV-LacZ and n = 7 for AV-PA28α, *P < 0.05 by Student’s t-Test). (o) Insulin tolerance test in DIO mice BAT-injected with AV-LacZ or AV-PA28α (Biol. replicates n = 5, *P < 0.05 by Student’s t-Test on AUC). (p) Strategy for intraBAT injection of AV-LacZ or AV-PA28α into ob/ob mice. (q) mRNA levels of PA28α (encoded by Psme1) in BAT of ob/ob mice BAT-injected with AV-LacZ or AV-PA28α (Biol. replicates n = 10 for AV-LacZ and n = 8 for AV-PA28α, normalized to Tbp, *P < 0.05 by Student’s t-Test). (r) Proteasome activity in ob/ob mice BAT-injected with AV-LacZ or AV-PA28α (Biol. replicates n = 10 for AV-LacZ and n = 8 for AV-PA28α, *P < 0.05 by Student’s t-Test). (s) Insulin tolerance test in DIO mice BAT-injected with AV-LacZ or AV-PA28α (Biol. replicates n = 10 for AV-LacZ and n = 8 for AV-PA28α, *P < 0.05 by Student’s t-Test on AUC).

Similar articles

Cited by

References

    1. Cannon B, Nedergaard J. Brown adipose tissue: function and physiological significance. Physiol Rev. 2004;84:277–359. doi: 10.1152/physrev.00015.2003. - DOI - PubMed
    1. Bartelt A, et al. Brown adipose tissue activity controls triglyceride clearance. Nat Med. 2011;17:200–205. doi: 10.1038/nm.2297. - DOI - PubMed
    1. Stanford KI, et al. Brown adipose tissue regulates glucose homeostasis and insulin sensitivity. J Clin Invest. 2013;123:215–223. doi: 10.1172/JCI62308. - DOI - PMC - PubMed
    1. Berbee JF, et al. Brown fat activation reduces hypercholesterolaemia and protects from atherosclerosis development. Nat Commun. 2015;6:6356. doi: 10.1038/ncomms7356. - DOI - PMC - PubMed
    1. Bartelt A, et al. Thermogenic adipocytes promote HDL turnover and reverse cholesterol transport. Nat Commun. 2017;8:15010. doi: 10.1038/ncomms15010. - DOI - PMC - PubMed

Online methods references

    1. Kong X, et al. IRF4 is a key thermogenic transcriptional partner of PGC-1alpha. Cell. 2014;158:69–83. doi: 10.1016/j.cell.2014.04.049. - DOI - PMC - PubMed
    1. Tschop MH, et al. A guide to analysis of mouse energy metabolism. Nat Methods. 2012;9:57–63. doi: 10.1038/nmeth.1806. - DOI - PMC - PubMed
    1. Cypess AM, et al. Anatomical localization, gene expression profiling and functional characterization of adult human neck brown fat. Nat Med. 2013;19:635–639. doi: 10.1038/nm.3112. - DOI - PMC - PubMed
    1. Rodbell M. Metabolism of Isolated Fat Cells. I. Effects of Hormones on Glucose Metabolism and Lipolysis. J Biol Chem. 1964;239:375–380. - PubMed
    1. Brand MD, Nicholls DG. Assessing mitochondrial dysfunction in cells. Biochem J. 2011;435:297–312. doi: 10.1042/BJ20110162. - DOI - PMC - PubMed

Publication types

MeSH terms

Substances