. 2018 Apr 2;128(4):1397-1412.
doi: 10.1172/JCI97650. Epub 2018 Mar 5.

iRhom2 promotes lupus nephritis through TNF-α and EGFR signaling

Affiliations

iRhom2 promotes lupus nephritis through TNF-α and EGFR signaling

Xiaoping Qing et al. J Clin Invest. .

Abstract

Lupus nephritis (LN) often results in progressive renal dysfunction. The inactive rhomboid 2 (iRhom2) is a newly identified key regulator of A disintegrin and metalloprotease 17 (ADAM17), whose substrates, such as TNF-α and heparin-binding EGF (HB-EGF), have been implicated in the pathogenesis of chronic kidney diseases. Here, we demonstrate that deficiency of iRhom2 protects the lupus-prone Fcgr2b-/- mice from developing severe kidney damage without altering anti-double-stranded DNA (anti-dsDNA) Ab production by simultaneously blocking HB-EGF/EGFR and TNF-α signaling in the kidney tissues. Unbiased transcriptome profiling of kidneys and kidney macrophages revealed that TNF-α and HB-EGF/EGFR signaling pathways are highly upregulated in Fcgr2b-/- mice, alterations that were diminished in the absence of iRhom2. Pharmacological blockade of either TNF-α or EGFR signaling protected Fcgr2b-/- mice from severe renal damage. Finally, kidneys from LN patients showed increased iRhom2 and HB-EGF expression, with interstitial HB-EGF expression significantly associated with chronicity indices. Our data suggest that activation of iRhom2/ADAM17-dependent TNF-α and EGFR signaling plays a crucial role in mediating irreversible kidney damage in LN, thereby uncovering a target for selective and simultaneous dual inhibition of 2 major pathological pathways in the effector arm of the disease.

Keywords: Autoimmunity; Inflammation; Lupus; Mouse models.


Conflict of interest statement

Conflict of interest: The authors have declared that no conflict of interest exists.

Figures

Figure 1
Figure 1. iRhom2 deficiency protected Fcgr2b–/– mice from severe kidney injury.
Female Fcgr2b–/– (F2b–/–) mice crossed with Rhbdf2–/– (iR2–/–) mice were assessed for survival and kidney injury. Survival (A), proteinuria (B), and BUN (C) were measured. For survival and proteinuria, n = 15 WT, n = 7 Rhbdf2–/–, n = 27 Fcgr2b–/–, and n = 24 Fcgr2b–/–Rhbf2–/– mice. For BUN, n = 5 WT, n = 5 Rhbdf2–/–, n = 20 Fcgr2b–/–, and n = 21 Fcgr2b–/–Rhbdf2–/– mice. For survival, the log-rank (Mantel-Cox) test was used. (D) Histological analysis of kidneys by PAS and Masson trichrome staining. Scale bars: 50 μm. Pathological scores for glomerular and tubular-interstitial areas. n = 4 WT, n = 4 Rhbdf2–/–, n = 20 Fcgr2b–/–, and n = 21 Fcgr2b–/–Rhbdf2–/– mice. (BD) Data are shown as mean ± SEM. *P < 0.05; **P < 0.01; ***P < 0.001; ****P < 0.0001, 1-way ANOVA with Dunnett’s multiple comparisons test.
Figure 2
Figure 2. iRhom2 deficiency rescued renal damage in Fcgr2b–/– mice without altering anti-dsDNA Ab levels.
(A) Transcription electron microscopy analysis of kidney cortex. Photographs shown represent 2 mice in each group with similar results. CL, capillary lumen; E, endothelial cell; F, fenestrae; FP, foot processes; P, podocyte; R, red blood cells. Asterisks show glomerular basement membrane. Scale bars: 5 μm (top panels; original magnification, ×5,000); 1 μm (bottom panels; original magnification, ×30,000). (B) Immunofluorescence staining of podocin in the kidney glomeruli. Scale bar: 25 μm. n = 4 WT, n = 4 Rhbdf2–/–, n = 12 Fcgr2b–/–, n = 12 Fcgr2b–/–Rhbdf2–/– mice. (C) IHC staining of KIM-1/TIM-1 (brown) in the kidneys. Scale bar: 50 μm. n = 10 Fcgr2b–/–, n = 9 Fcgr2b–/–Rhbdf2–/– mice. (D) Serum anti-dsDNA Abs in 7- to 9-month-old mice. n = 13 WT, n = 7 Rhbdf2–/–, n = 24 Fcgr2b–/–, n = 24 Fcgr2b–/–Rhbdf2–/– mice. Data are shown as mean ± SEM. *P < 0.05; **P < 0.01; ****P < 0.0001, 1-way ANOVA with Dunnett’s multiple comparisons test (B and D), 2-tailed unpaired Student’s t test (C).
Figure 3
Figure 3. Deficiency of iRhom2 attenuated inflammatory cell infiltration without affecting renal deposition of IC and C3 in the kidneys of Fcgr2b–/– mice.
(A) Kidneys were stained for mIgG and C3 by immunofluorescence. Photographs shown represent kidneys from n = 4 WT, n = 4 Rhbdf2–/–, n = 10 Fcgr2b–/–, and n = 10 Fcgr2b–/–Rhbdf2–/– mice. Scale bar: 25 μm. (BF) Inflammatory cell infiltrates were analyzed by flow cytometry in mouse kidneys. Cell numbers of CD45+ leukocytes (B), macrophages (C), neutrophils (D), Ly6Chi monocytes, (E) and T cell subsets (F) are illustrated. Numbers shown are cells per kidney. (BE) n = 8 WT, n = 5 Rhbdf2–/–, 8 Fcgr2b–/–, n = 8 Fcgr2b–/–Rhbdf2–/– mice. (F) n = 10 Fcgr2b–/–, n = 9 Fcgr2b–/–Rhbd2–/– mice. Data are shown as mean ± SEM. *P < 0.05; **P < 0.01; ***P < 0.001; ****P < 0.0001, 1-way ANOVA with Dunnett’s multiple comparisons test (AE), 2-tailed unpaired Student’s t test (F).
Figure 4
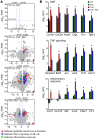
Figure 4. RNA-seq analysis of kidneys from Fcgr2b–/– mice.
(A) Volcano plots of genes differentially expressed between indicated mouse genotypes (P = 0.01, FC = 2). Differentially expressed genes that belong to the enriched hallmark gene sets identified by GSEA are shown in colors, as indicated. (B) Expression of representative genes in the hallmark gene sets. Data are shown as mean ± SEM. *P < 0.01. n = 4 mice per group. Serpine1, serpin peptidase inhibitor, clade E member 1; Bcl3, B cell CLL/lymphoma 3; Jun, jun oncogene; Junb, jun B proto-oncogene; Csf1, colony stimulating factor 1; Icam1, intercellular adhesion molecule 1; C5ar1, complement C5a receptor 1; Il1r1, interleukin 1 receptor type 1.
Figure 5
Figure 5. Local inflammation and tissue injury/remodeling in Fcgr2b–/– kidneys were attenuated by iRhom2 deficiency.
(A) Measurement of CXCL1, IL-34, CXCL13, and LCN2 proteins in kidney lysates by ELISA. n = 4 WT, n = 4 Rhbdf2–/–, n = 10 Fcgr2b–/–, n = 10 Fcgr2b–/–Rhbdf2–/– mice. (B) Expression of fibronectin in kidneys. n = 4 WT, n = 4 Rhbdf2–/–, n = 8 Fcgr2b–/–, n = 8 Fcgr2b–/–Rhbdf2–/– mice. (C) Renal expression of Rhbdf2 measured by RNA-seq (n = 4 mice/group) and by qPCR. n = 4 WT, n = 4 Rhbdf2–/–, 8 Fcgr2b–/–, n = 8 Fcgr2b–/–Rhbdf2–/– mice. (D) ADAM17 expression in the kidneys by Western blot. β-actin was used as loading control. n = 4 WT, n = 4 Rhbdf2–/–, n = 6 Fcgr2b–/–, n = 6 Fcgr2b–/–Rhbdf2–/– mice. Data are shown as mean ± SEM. *P < 0.05; **P < 0.01; ***P < 0.001; ****P < 0.0001, 1-way ANOVA with Dunnett’s multiple comparisons test except RNA-seq data.
Figure 6
Figure 6. Activation of kidney macrophages was associated with renal injury in Fcgr2b–/– mice.
(A) Staining of F4/80+ macrophages in the kidneys of Fcgr2b–/– and Fcgr2b–/–Rhbdf2–/– mice by immunohistochemistry. Brown shows F4/80+. (n = 10 Fcgr2b–/–, n = 9 Fcgr2b–/–Rhbdf2–/– mice). Data are shown as mean ± SEM. Scale bar: 25 μm. **P < 0.01, 2-tailed Mann-Whitney U test. (B) Expression of CD11b in CD45+F4/80hiCD11b+ kidney macrophage population assessed by flow cytometry. n = 11 WT, n = 6 Rhbdf2–/–, n = 11 Fcgr2b–/–, n = 13 Fcgr2b–/–Rhbdf2–/– mice. Data are shown as mean ± SEM. *P < 0.05; ****P < 0.0001, 1-way ANOVA with Dunnett’s multiple comparisons test. (C) Correlation analysis of kidney macrophage CD11b levels and proteinuria. n = 11 WT, n = 6 Rhbdf2–/–, n = 11 Fcgr2b–/–, n = 13 Fcgr2b–/–Rhbdf2–/– mice, 41 mice in total. Spearman’s correlation, 2-tailed.
Figure 7
Figure 7. Comparison of differentially expressed genes in total kidneys and kidney macrophages of Fcgr2b–/– mice.
(A) Comparison of differentially expressed genes (Fcgr2b–/– vs. WT) in total kidneys (TK) and kidney macrophages (MF). Bar graph illustrates the top 10 enriched gene sets identified in the 381 shared genes by overrepresentation analysis using LINCS data sets. (B) Expression of HB-EGF–induced genes from LINCS data set in total kidneys (n = 4 mice/group) and kidney macrophages (n = 3 mice/group). FC > 2, P < 0.01 by EdgeR. See Methods.
Figure 8
Figure 8. Activation of EGFR signaling in the kidneys of Fcgr2b–/– mice was diminished by iRhom2 deficiency.
(A) Kidney expression of p-EGFR and p-ERK1/2. Total ERK1/2 was used as control (n = 4 WT, n = 4 Rhbdf2–/–, n = 9 Fcgr2b–/–, n = 9 Fcgr2b–/–Rhbdf2–/– mice). (B) Kidney expression of EGFR ligands and the Egfr gene on RNA-seq (n = 4 mice per group) and renal Hbegf expression measured by qPCR (n = 4 WT, n = 4 Rhbdf2–/–, n = 8 Fcgr2b–/–, n = 8 Fcgr2b–/–Rhbdf2–/– mice). Data are shown as mean ± SEM. *P < 0.05; **P < 0.01; ***P < 0.001; ****P < 0.0001, 1-way ANOVA with Dunnett’s multiple comparisons test. ND, not detected.
Figure 9
Figure 9. Blockade of EGFR signaling protected Fcgr2b–/– mice from severe kidney injury.
Female Fcgr2b–/– mice were treated with erlotinib (E) or vehicle control (V) (10 mice/group). Kidney damage was assessed by BUN (A), proteinuria (B) and histology (C, PAS and Masson trichrome staining). Scale bars: 50 μm. (D) Serum anti-dsDNA IgGs upon euthanasia between 7 and 9 months. (E) qPCR analysis of renal expression of Ctgf and Col1a1. n = 3 WT, n = 3 Rhbdf2–/–, n = 8 vehicle-treated Fcgr2b–/– mice, n = 8 erlotinib-treated Fcgr2b–/– mice, n = 8 Fcgr2b–/–Rhbdf2–/– mice. (F) Kidney expression of p-EGFR and p-ERK1/2. Total ERK1/2 was used as control. Data are shown as mean ± SEM. *P < 0.05; **P < 0.01; ***P < 0.001, 2-tailed unpaired Student’s t test (A, B, D, F), 2-tailed Mann-Whitney U test (C), 1-way ANOVA with Dunnett’s multiple comparisons test (E).
Figure 10
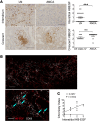
Figure 10. Increased expression of HB-EGF in the kidneys of LN patients.
(A) HB-EGF staining in the interstitium and glomerular crescents of LN and ANCA patients (n = 9 LN class IV patients with crescents, n = 10 ANCA patients). Data are shown as mean ± SEM. ***P < 0.001, 2-tailed unpaired Student’s t test. Scale bars: 50 μm (upper panels); 100 μm (lower panels). (B) Sequential HB-EGF and CD68 staining in the kidney interstitium of LN patients. Arrows indicate overlapping staining of HB-EGF (red nuclei) and CD68 (white cytoplasm). Scale bars: 100 μm (top); 50 μm (bottom). (C) Correlation of interstitial HB-EGF and chronicity of lupus patients. n = 24 LN patients (n = 18 class IV and n = 6 class V). Two-tailed Spearman’s correlation.
Figure 11
Figure 11. Activation of the TNF-α pathway was required for kidney damage in Fcgr2b–/– mice.
(A) Expression of Tnf, Tnfrsf1a, and Tnfrsf1b in the kidneys of Fcgr2b–/– mice measured by RNA-seq. n = 4 mice/group. (B and C) Fcgr2b–/– mice were treated with murine p75TNFR:Fc or PBS. Kidney damage was assessed by proteinuria (albumin/creatinine ratio), BUN (B), and histology analysis (C, PAS and Masson trichrome staining). Scale bars: 50 μm. (n = 10 PBS-treated Fcgr2b–/– mice, n = 8 p75TNFR:Fc-treated Fcgr2b–/– mice). Data are shown as mean ± SEM. *P < 0.05; ***P < 0.001; ****P < 0.0001, 2-tailed unpaired Student’s t test (B), 2-tailed Mann-Whitney U test (C), EdgeR (A); see Methods.
Figure 12
Figure 12. Blockade of TNF-α signaling ameliorated overexpression of profibrotic factors in Fcgr2b–/– kidneys.
Fcgr2b–/– mice were treated with murine p75TNFR:Fc or PBS. Serum anti-dsDNA Abs (A), renal expression of Ctgf, Col1a1,and Hbegf (B), and kidney expression of fibronectin, p-EGFR, EGFR, p-ERK1/2, and ERK1/2 (C) were assessed. n = 3 WT, n = 10 PBS-treated Fcgr2b–/– mice, n = 8 p75TNFR:Fc-treated Fcgr2b–/– mice. Data are shown as mean ± SEM. *P < 0.05, 2-tailed unpaired Student’s t test (AC, p-EGFR and p-ERK1/2), 2-tailed Mann-Whitney U test (C, fibronectin).
Figure 13
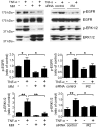
Figure 13. TNF-α transactivates EGFR via iRhom2/ADAM17 in podocyte cell line.
MPC5 cells pretreated with marimastat (MM) or transfected with siRNA were stimulated with mouse TNF-α. Expression of p-EGFR, EGFR, p-ERK1/2, and ERK1/2 was assessed by Western blot. Densitometry of p-EGFR and p-ERK1/2 expression was calculated as ratios against total EGFR or ERK1/2, respectively. Data are shown as mean ± SEM. n = 3 independent experiments. *P < 0.05; **P < 0.01, 1-way ANOVA with Dunnett’s multiple comparisons test.

Comment in

Similar articles

Cited by

References

    1. Mohan C, Putterman C. Genetics and pathogenesis of systemic lupus erythematosus and lupus nephritis. Nat Rev Nephrol. 2015;11(6):329–341. doi: 10.1038/nrneph.2015.33. - DOI - PubMed
    1. Davidson A. What is damaging the kidney in lupus nephritis? Nat Rev Rheumatol. 2016;12(3):143–153. doi: 10.1038/nrrheum.2015.159. - DOI - PMC - PubMed
    1. Yung S, Chan TM. Anti-DNA antibodies in the pathogenesis of lupus nephritis--the emerging mechanisms. Autoimmun Rev. 2008;7(4):317–321. doi: 10.1016/j.autrev.2007.12.001. - DOI - PubMed
    1. Nimmerjahn F, Ravetch JV. Fcgamma receptors as regulators of immune responses. Nat Rev Immunol. 2008;8(1):34–47. doi: 10.1038/nri2206. - DOI - PubMed
    1. Moulton VR, Suarez-Fueyo A, Meidan E, Li H, Mizui M, Tsokos GC. Pathogenesis of human systemic lupus erythematosus: a cellular perspective. Trends Mol Med. 2017;23(7):615–635. doi: 10.1016/j.molmed.2017.05.006. - DOI - PMC - PubMed

Publication types

MeSH terms