. 2018 Mar 5;217(3):975-995.
doi: 10.1083/jcb.201704184. Epub 2018 Jan 24.

Rab18 promotes lipid droplet (LD) growth by tethering the ER to LDs through SNARE and NRZ interactions

Affiliations

Rab18 promotes lipid droplet (LD) growth by tethering the ER to LDs through SNARE and NRZ interactions

Dijin Xu et al. J Cell Biol. .

Abstract

Lipid incorporation from endoplasmic reticulum (ER) to lipid droplet (LD) is important in controlling LD growth and intracellular lipid homeostasis. However, the molecular link mediating ER and LD cross talk remains elusive. Here, we identified Rab18 as an important Rab guanosine triphosphatase in controlling LD growth and maturation. Rab18 deficiency resulted in a drastically reduced number of mature LDs and decreased lipid storage, and was accompanied by increased ER stress. Rab3GAP1/2, the GEF of Rab18, promoted LD growth by activating and targeting Rab18 to LDs. LD-associated Rab18 bound specifically to the ER-associated NAG-RINT1-ZW10 (NRZ) tethering complex and their associated SNAREs (Syntaxin18, Use1, BNIP1), resulting in the recruitment of ER to LD and the formation of direct ER-LD contact. Cells with defects in the NRZ/SNARE complex function showed reduced LD growth and lipid storage. Overall, our data reveal that the Rab18-NRZ-SNARE complex is critical protein machinery for tethering ER-LD and establishing ER-LD contact to promote LD growth.


Figures

Figure 1.
Figure 1.
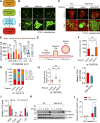
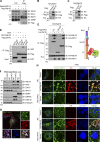
Defective LD growth and maturation in Rab18-deficient cells. (A) Outline of strategy to screen for LD-associated Rabs involved in LD growth. (B) Knocking down Rab18 alters LD morphology in 3T3-L1 preadipocytes. Bars: 10 µm; (insets) 2 µm. (C) Representative images of LDs (green) in negative control (NC) or Rab18-deficient (Rab18 KO) 3T3-L1 preadipocytes. Red represents Cherry expression. Bars: 10 µm; (insets) 2 µm. (D) Histogram showing the mean number of LDs in each diameter in C. Data represent mean ± SD (n = 24 cells for NC; n = 25 cells for Rab18 KO; n = 29 cells for Rab18 KO+Rab18; ***, P < 0.001; NS, no significance by Kruskal-Wallis test). (E) Schematic diagram showing the process of LD biogenesis and growth. (F–H) Quantification of the number of mature LDs under fluorescent microscope (F), the percentage of LDs in each diameter (G), and diameter of the largest LD in each cell (H) in C. Mean ± SD for F, mean value for G, mean ± SEM for H, n = 24 cells for NC; n = 25 cells for Rab18 KO; n = 29 cells for Rab18 KO+Rab18; ***, P < 0.001; NS, no significance by Kruskal-Wallis test. (I) Reduced total TAG levels in Rab18 KO 3T3-L1 preadipocytes. TAG/protein level of control cells was normalized to 1. Three independent experiments were performed. Mean ± SD; n = 3; **, P < 0.01 by two-tailed t test. (J) Relative TAG level in various subcellular fractions. TAG level in PNS in control cells was normalized to 1. Three independent experiments were performed. Mean ± SD; n = 3; *, P < 0.05; **, P < 0.01; NS, no significance by two-tailed t test. (K and L) Increased BIP expression and mRNA levels of spliced XBP-1 in Rab18 KO 3T3-L1 preadipocytes after OA (400 µM) treatment. Cells treated with 1 µM TG for 6 h were used as a positive control. Three independent experiments were performed. Mean ± SD; n = 3; *, P < 0.05; **, P < 0.01 by two-tailed t test. All experiments were performed at least twice. WT, wild type.
Figure 2.
Figure 2.
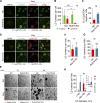
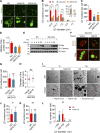
Rab18 deficiency causes abnormal LD growth in adipocytes and Leydig cells. (A and B) Knocking down Rab18 alters LD (green) sizes in adipocytes. Bars: 10 µm; (insets) 5 µm. (B) Size distribution of the largest LD. LDs from 88 siRab18-transfected cells and 116 siNC-transfected cells were analyzed (pooled from three experiments). LD size distribution was fitted with Gaussian function. (C and D) Overexpressing Rab18 decreases LD sizes in adipocytes. Green, GFP; red, LDs. Bars: 10 µm; (insets) 5 µm. (D) The size distribution of the largest LD. LDs from 121 Rab18-transfected cells and 100 vector-transfected cells were analyzed (pooled from three experiments). LD size distribution was fitted with Gaussian function. (E) Relative cellular TAG levels in adipocytes. TAG/protein level of siNC was normalized to 1. Three independent experiments were performed. Mean ± SD; n = 3; ***, P < 0.001 by two-tailed t test. (F) Reduced basal and stimulated lipolysis in Rab18 knockdown adipocytes. The amount of free glycerol released from siNC cells without the treatment of isoproterenol (iso) and 3-isobutyl-1-methylxanthine (IBMX) was normalized to 1. Three independent experiments were performed. Mean ± SD; n = 3; **, P < 0.01; ***, P < 0.001 by one-way ANOVA with Tukey post hoc tests. (G and H) Rab18 deficiency in TM-3 Leydig cell alters LD morphology. Green, LDs. Bars: 5 µm; (insets) 2 µm. (H) Histogram showing the mean number of LDs in G. Mean ± SD; n = 10; ***, P < 0.001; NS, no significance by two-tailed t test. All experiments were performed at least twice.
Figure 3.
Figure 3.
Rab18 controls the growth of nascent LDs. (A–C) Similar number of nascent LDs labeled with GFP-LiveDrop in control and Rab18 KO cells. Green, GFP-LiveDrop; red, LipidTOX neutral red. Circles, LipidTOX-positive LDs; dotted line circles, LipidTOX-negative LDs. Bars: 5 µm; (insets) 2 µm. (B) Quantification of the number of LiveDrop-positive LDs and LipidTOX-positive LDs. Mean ± SD; n = 10 for control cells, n = 11 for Rab18 KO cells; NS, no significance; ***, P < 0.001 by two-tailed t test. (C) The percentage of LDs that were LiveDrop-positive but LipidTOX-negative. Mean ± SD; n = 10 for control cells, n = 11 for Rab18 KO cells; ***, P < 0.001 by Mann-Whitney test. (D) Representative images showing LiveDrop-positive (green) LDs in cells treated with OA for 4 h. Red, LipidTOX neutral red. Bars: 5 µm; (insets) 2 µm. (E) Representative EM images showing the LD morphology in Rab18 KO and in control 3T3-L1 preadipocytes. Red arrows, the nascent LDs; orange arrows, the mature LDs; blue arrows, the supersized LDs. Bars, 500 nm. (F) Number of LDs in randomly selected EM image fields in cells treated with OA for 1 h in E. Mean ± SD; n = 147 ROIs for control cells, n = 154 ROIs for Rab18 KO cells; ***, P < 0.001 by Mann-Whitney test. (G and H) Total number of LDs (G) and the mean number of LDs in each diameter in cells (H) that were treated with OA for 8 h in E. Mean ± SD; n = 22 ROIs for control cells, n = 29 ROIs for Rab18 KO cells; **, P < 0.01; ***, P < 0.001; NS, no significance by Mann-Whitney test. All experiments were performed at least twice.
Figure 4.
Figure 4.
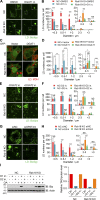
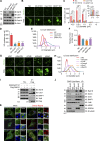
TAG synthesis on ER is required for Rab18-controled LD growth. (A and B) Inhibition of DGAT1 activity reduced the size and number of LDs in both control (NC) and Rab18 KO cells. 1 µM of DGAT1 inhibitor (DGAT1 in.) was used. Green, LDs. Bars: 10 µm; (insets) 2 µm. Histogram in B showing the mean number of LDs in each diameter in A. Mean ± SD; n = 11–18 for each genotype; *, P < 0.05; ***, P < 0.001; NS, no significance by two-tailed t test. (C and D) Rab18 KO cells expressing DGAT1 did not accumulate mature LDs. Red, LDs. Bars: 5 µm; (insets) 2 µm. Histogram in D showing the mean number of LDs in each diameter in C. Mean ± SD; n = 19–28 cells for each genotype; *, P < 0.05; **, P < 0.01; ***, P < 0.001; NS, no significance by two-tailed t test. (E and F) Inhibition of DGAT2 did not affect the numbers and sizes of LDs in Rab18 KO cells. 2 µM of DGAT2 inhibitor was used. Bars: 10 µm; (insets) 2 µm. Histogram in F showing the mean number of LDs in each diameter in E. Mean ± SD; n = 9–11 for each genotype; *, P < 0.05; NS, no significance by two-tailed t test. (G and H) Knocking down GPAT3/4 reduced the number and sizes of mature LDs in Rab18 KO cells. Bars: 5 µm; (insets) 2 µm. Histogram in H showing the mean number of LDs in each diameter in G. Mean ± SD; n = 10; *, P < 0.05; ***, P < 0.001; NS, no significance by two-tailed t test. (I) Reduced TAG and increased ER stress in Rab18 KO cells treated with FAs. Left: Representative Western blot showing the ER stress in Rab18 KO cells. From three independent experiments. Right: Subcellular TAG levels of one representative experiment. All experiments were performed at least twice.
Figure 5.
Figure 5.
Rab3GAP1/2 controls the activity and LD localization of Rab18. (A) Endogenous Rab18 (green) was associated with LDs (red) in 3T3-L1 preadipocytes. Bars: 10 µm; (insets) 2 µm. (B) Rab18 was enriched in LD fraction isolated from 3T3-L1 preadipocytes. ADRP, LD marker; GRP94, a microsomal marker; β-tubulin, a cytosol marker. (C) Rab18 (green) was associated with LD (blue) at early stage of LD biogenesis. Red, endogenous ACSL3. Bars: 10 µm; (insets) 2 µm. (D) Representative SIM superresolution images showing the localization of HA-Rab3GAP2 (red) and GFP-Rab18 (green) on LDs (blue). Bars: 10 µm; (insets) 1 µm. (E) Rab18 (green) was not localized to LDs (blue) in Rab3GAP1- or Rab3GAP2-deficient cells. Red, ACSL3. Bars: 10 µm; (insets) 2 µm. (F) Rab18 was not enriched in the LD fraction in Rab3GAP1-deficient cells. (G and H) Reduced mature LDs and the presence of supersized LDs in Rab3GAP1/2-deficient cells. Bars: 10 µm; (insets) 2 µm. Histogram in H showing the mean number of LDs in each diameter in G. Mean ± SD; n = 13 for control cells, n = 20 for Rab3GAP1 KO cells, n = 16 for Rab3GAP2 KO cells; ***, P < 0.001 by one-way ANOVA with Tukey post hoc tests. (I) Increased LD (green) sizes in Rab3GAP1-deficient adipocytes. Bars: 10 µm; (insets) 5 µm. All experiments were performed at least twice.
Figure 6.
Figure 6.
Rab18 binds to NRZ tethering complex. (A) Rab18 interacted with NRZ complex. (B and C) Rab18 interacted with ZW10. (D) ZW10 interacted with GTP-bound Rab18 in vitro with a higher affinity. (E) ZW10 enhanced the interaction between Rab18 and NAG. Right: Schematic diagram showing the interaction pattern between Rab18 and NRZ complex. (F) The LD association of NAG and ZW10 was dependent on Rab18. Subcellular fractions were isolated from control or Rab18-deficient TM-3 cells. ADRP, GRP94, GM130, and β-tubulin represent LD, microsomal, Golgi, and cytosolic markers, respectively. (G) Colocalization of HA-Rab18 (pink), Cherry-ZW10 (red), and endogenous NAG (green) on LDs (blue). Bars: 10 µm; (insets) 2 µm. (H) Association of endogenous ZW10 (green) or endogenous NAG (green) with LDs (blue) in the presence of Rab18 (red). Bars: 10 µm; (insets) 2 µm. All experiments were performed at least twice. FL, full-length.
Figure 7.
Figure 7.
NRZ complex acts as a downstream effector of Rab18 to control LD growth. (A–C) Increased supersized LDs and reduced mature LDs in NAG-deficient (NAG KO) and ZW10-deficient (ZW10 KO) 3T3-L1 preadipocytes. Bars: 10 µm; (insets) 2 µm. (B) The mean number of LDs in each diameter in A. (C) Quantification of the number of mature LDs per cell in A. Mean ± SD; n = 13 for control cells, n = 22 for NAG-deficient cells, n = 20 for ZW10-deficient cells; ***, P < 0.001 by one-way ANOVA with Tukey post hoc tests. (D) Reduced cellular TAG levels in NAG KO- and ZW10 KO 3T3-L1 preadipocytes. Three independent experiments were performed. Mean ± SD; n = 3; *, P < 0.05; **, P < 0.01 by one-way ANOVA with Tukey post hoc tests. (E) Increased ER stress in NAG KO cells after long-term OA treatment (400 µM). Cells treated with 1 µM TG for 6 h were used as a positive control. (F–H) Introduction of Cherry-Rab18 (red) into NAG KO cells did not restore its function in the accumulation of mature LDs. (F) Representative images of LD morphology. LDs were stained with Bodipy 493/503. Green, LDs; red, Cherry. Bars: 10 µm; (insets) 2 µm. (G) Quantification of the number of mature LDs in each cell Mean ± SD; n = 25 cells for vector-transfected cells, n = 27 cells for Rab18-transfected cells; NS, no significance by Mann-Whitney test. (H) Quantification of the size of the largest LD in each cell Mean ± SEM; n = 31 cells for vector-transfected cells, n = 33 cells for Rab18-transfected cells; NS, no significance by two-tailed t test. (I) Representative EM images showing LD morphology in control and NAG KO 3T3-L1 preadipocytes. Bars, 500 nm. (J) The total number of LDs in each cell treated with OA for 1 h was increased. Mean ± SD; n = 137 ROIs for control cells, n = 154 ROIs for NAG-deficient cells; ***, P < 0.001 by Mann-Whitney test. (K and L) Defective LD growth and maturation in NAG KO cells treated with OA for 8 h. Number of LDs (K) and histogram of the mean number of LDs (L) in each diameter in cells treated with OA for 8 h in K. Mean ± SD; n = 25 ROIs for control cells, n = 29 ROIs for NAG-deficient cells; ***, P < 0.001; NS, no significance by Mann-Whitney test. All experiments were performed at least twice.
Figure 8.
Figure 8.
ER-associated SNAREs control LD growth by interacting with Rab18/NRZ. (A–D) KO ER-associated Q-SNAREs (Stx18, Use1, and BNIP1) in 3T3-L1 preadipocytes led to defective LD growth and the accumulation of supersized LDs. (A) Western Blot showing the expression level of indicated protein in 3T3-L1 preadipocytes. (B) Representative images of LD morphology. Bars: 10 µm; (insets) 2 µm. (C) Histogram showing the number of LDs in each diameter in B. (D) Quantification of the number of mature LDs in B. Mean ± SD; n = 15–20 for each genotype; ***, P < 0.001 by one-way ANOVA with Tukey post hoc tests. (E) The size distribution of the largest LD in each cell in B. The diameters of LDs from 218–252 cells/genotype (pooled from three experiments) were fitted with Gaussian function. (F) Reduced cellular TAG levels in Stx18-deficient, Use1-deficient, or BNIP1-deficient 3T3-L1 preadipocytes. Three independent experiments were performed. Mean ± SD; n = 3; ***, P < 0.001 by one-way ANOVA with Tukey post hoc tests. (G) LD morphology in 3T3-L1 preadipocytes knocking down R-SNAREs (Sec22b, Ykt6, and Vamp8). Green, LDs. Bars: 10 µm; (insets) 2 µm. (H) The LD size distribution in G. The diameters of LDs from 97–206 cells/genotype (pooled from three experiments) were fitted with Gaussian function. (I) Rab18 interacts with ER-associated Q-SNAREs. (J and K) The LD association of ER-associated Q-SNAREs is dependent on Rab18 by biochemical fractionation (J) and imaging (K) analyses. Subcellular fractions were isolated from control or Rab18 KO TM-3 cells. In K, Q-SNAREs, LD, and Cherry-Rab18 were labeled green, blue, and red, respectively. Bars: 10 µm; (insets) 2 µm. All experiments were performed at least twice.
Figure 9.
Figure 9.
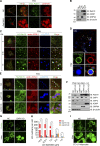
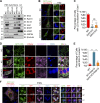
Rab18/NRZ/SNARE complex establishes ER–LD contact. (A) Presence of ER-associated SNAREs in LD fraction is dependent on NAG. Subcellular fractions were isolated from control or NAG KO 3T3-L1 preadipocytes. (B and C) Use1 (green) was colocalized with Rab18 (red) to LDs (blue) in the control but not in NAG KO or ZW10 KO 3T3-L1 preadipocytes. Bars: 5 µm; (insets) 2 µm. (C) Quantitative analysis. Cells with Rab18 were selected for calculation and LDs with GFP-Use1 localization were counted as positive. Three independent experiments were performed. Mean ± SD; n = 3; ***, P < 0.001; NS, no significance by one-way ANOVA with Tukey post hoc tests. (D) Colocalization of CB5 (green, an ER-associated protein), Rab18 (red), and BNIP1 (pink) on LDs in wild-type but not in NAG KO cells. Bars: 10 µm; (insets) 2 µm. (E) Quantification of percentage of cells containing CB5 positive LDs in D. Rab18-positive cells were selected for calculation. Three independent experiments were performed. Mean ± SD; n = 3; ***, P < 0.001 by two-tailed t test. (F) Colocalization of GFP-Use1 (green), RFP-KEDL (red, an ER-specific marker) and HA-Rab18 (pink) on LDs. 3D view of indicated channels are shown in xy, xz, or yz direction. Bars: 10 µm; (insets) 2 µm. All experiments were performed at least twice.
Figure 10.
Figure 10.
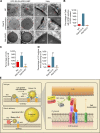
Tethering LDs to ER by Rab18/NRZ/SNARE complex controls LD growth. (A) Representative EM images showing a close contact between ER and LD in Rab18 overexpressing cells. ER cisternae are indicated with blue arrow; ER–LD contact sites are indicated with red arrows. Bars: (1–5) 500 nm; (6) 1 µm; (insets) 100 nm. (B) Quantification of percentage of cells containing APEX-Stx18–positive ER–LD contact (22–39 cells/genotype, pooled from two experiments). (C) Quantification of percentage of LDs apposing to ER per ROI. Mean ± SD; n = 11–17 ROIs/genotype; ***, P < 0.001 by two-tailed t test. (D) Quantification of percentage of LD surface area apposing to ER per ROI. Mean ± SD; n = 11–17 ROIs/genotype; ***, P < 0.001 by Mann-Whitney test. (E) Working model: Rab18-GTP binds to the NRZ tethering complex and its associated Q-SNAREs to recruit ER to the close proximity of LDs to create a contact between ER and LDs, allowing the transfer of TAG from ER to LDs at the interface of ER–LD to promote nascent LD growth. All experiments were performed at least twice. O.E., overexpression.

Similar articles

Cited by

References

    1. Aligianis I.A., Johnson C.A., Gissen P., Chen D., Hampshire D., Hoffmann K., Maina E.N., Morgan N.V., Tee L., Morton J., et al. . 2005. Mutations of the catalytic subunit of RAB3GAP cause Warburg Micro syndrome. Nat. Genet. 37:221–223. 10.1038/ng1517 - DOI - PubMed
    1. Anand P., Cermelli S., Li Z., Kassan A., Bosch M., Sigua R., Huang L., Ouellette A.J., Pol A., Welte M.A., and Gross S.P.. 2012. A novel role for lipid droplets in the organismal antibacterial response. eLife. 1:e00003 10.7554/eLife.00003 - DOI - PMC - PubMed
    1. Andag U., Neumann T., and Schmitt H.D.. 2001. The coatomer-interacting protein Dsl1p is required for Golgi-to-endoplasmic reticulum retrieval in yeast. J. Biol. Chem. 276:39150–39160. 10.1074/jbc.M105833200 - DOI - PubMed
    1. Arasaki K., Taniguchi M., Tani K., and Tagaya M.. 2006. RINT-1 regulates the localization and entry of ZW10 to the syntaxin 18 complex. Mol. Biol. Cell. 17:2780–2788. 10.1091/mbc.E05-10-0973 - DOI - PMC - PubMed
    1. Ariotti N., Hall T.E., Rae J., Ferguson C., McMahon K.A., Martel N., Webb R.E., Webb R.I., Teasdale R.D., and Parton R.G.. 2015. Modular Detection of GFP-Labeled Proteins for Rapid Screening by Electron Microscopy in Cells and Organisms. Dev. Cell. 35:513–525. 10.1016/j.devcel.2015.10.016 - DOI - PubMed

Publication types