. 2018 Feb;25(2):176-184.
doi: 10.1038/s41594-017-0015-3. Epub 2018 Jan 8.

Spatiotemporal allele organization by allele-specific CRISPR live-cell imaging (SNP-CLING)

Affiliations

Spatiotemporal allele organization by allele-specific CRISPR live-cell imaging (SNP-CLING)

Philipp G Maass et al. Nat Struct Mol Biol. 2018 Feb.

Abstract

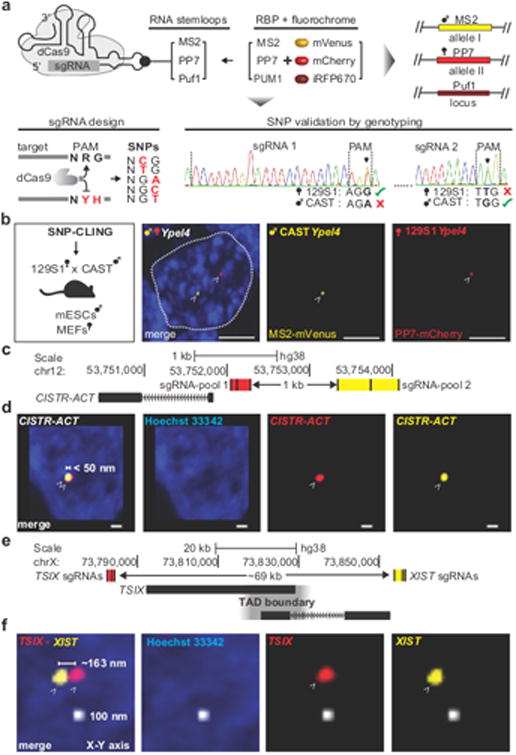
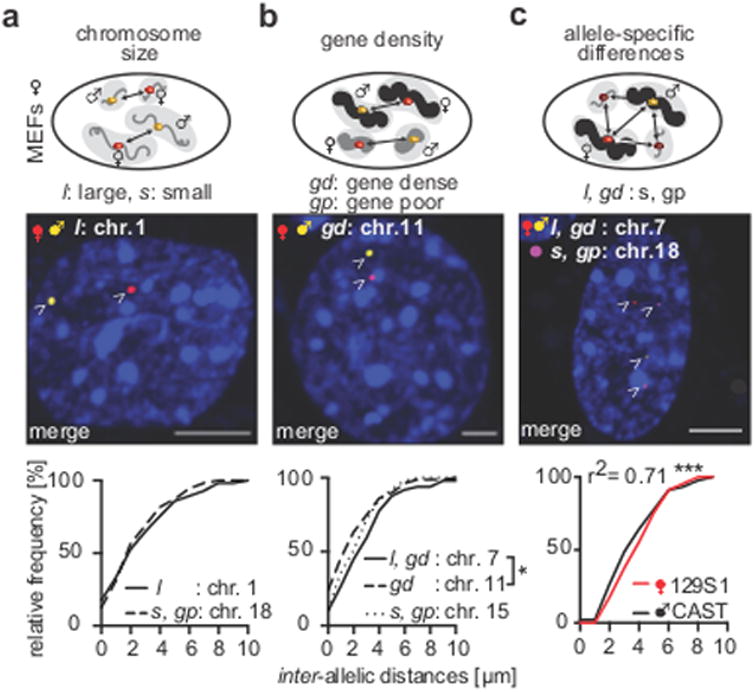
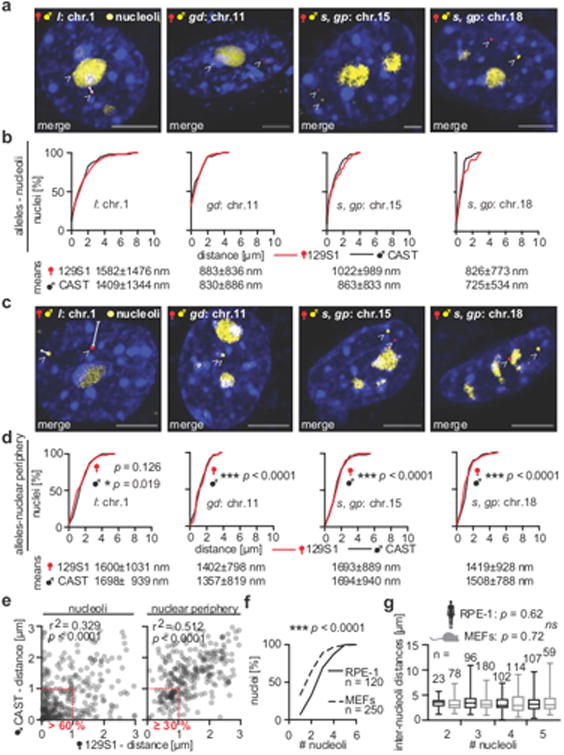
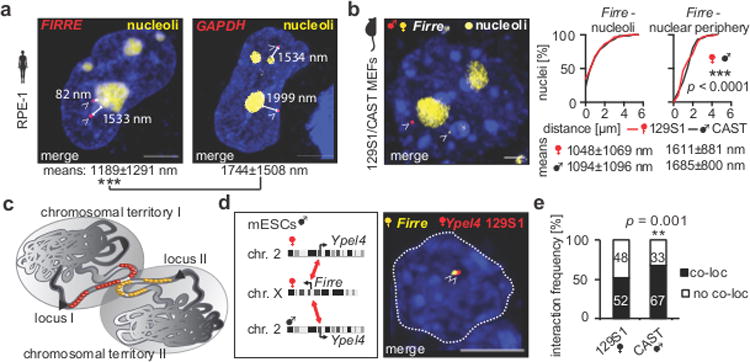
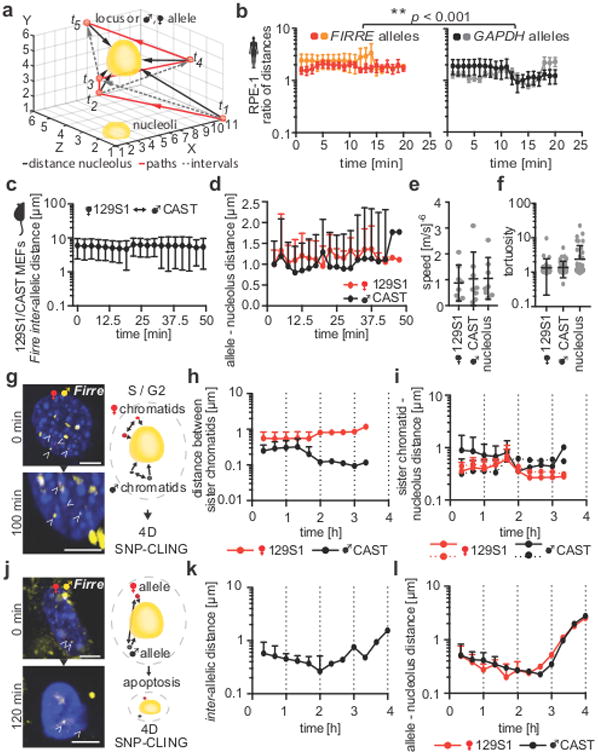
Imaging and chromatin capture techniques have provided important insights into our understanding of nuclear organization. A limitation of these techniques is the inability to resolve allele-specific spatiotemporal properties of genomic loci in living cells. Here, we describe an allele-specific CRISPR live-cell DNA imaging technique (SNP-CLING) to provide the first comprehensive insights into allelic positioning across space and time in mouse embryonic stem cells and fibroblasts. With 3D imaging, we studied alleles on different chromosomes in relation to one another and relative to nuclear substructures such as the nucleolus. We find that alleles maintain similar positions relative to each other and the nucleolus; however, loci occupy unique positions. To monitor spatiotemporal dynamics by SNP-CLING, we performed 4D imaging and determined that alleles are either stably positioned or fluctuating during cell state transitions, such as apoptosis. SNP-CLING is a universally applicable technique that enables the dissection of allele-specific spatiotemporal genome organization in live cells.


Figures

Figure 1
Figure 1. SNP-CLING or CLING labeling in live cells
(a) sgRNAs harboring internal protein-binding RNA-motifs (MS2, or PP7, or Puf1) direct non-catalytic dCas9 to each targeted locus. The corresponding RNA-binding proteins (RBP) MS2, or PP7, or PUM1, are fused to mVenus, or mCherry, or iRFP670, and fluorescently label up to three different loci. For allele-specific labelling, either the 2nd or 3rd nucleotide in the dCas9 PAM-motif 5′-NRG-3′ was substituted by a heterozygous SNP to a non-specific dCas9-motif (IUPAC code: ‘Y’ = ‘C’ or ‘T’; ‘H’ = ‘A’, ‘C’ or ‘T’), thereby preventing dCas9-binding to either the 129S1 or CAST alleles in mouse hybrid cells. Sanger sequencing of selected SNPs confirmed heterozygosity. (b) Allele-specific visualization of 129S1-Ypel4 (yellow = MS2-mVenus) and CAST-Ypel4 (red = PP7-mCherry) in male 129S1/CAST mESCs (scale bar = 5 μm, n = 4, 35 nuclei, dashed line = mESC nucleus, arrowheads = SNP-CLING foci of maternal and paternal Ypel4 alleles). (c) Three sgRNAs in MS2 and another set of three sgRNAs in PP7 targeted the CISTR-ACT locus (sgRNA-pool 1 and 2) in RPE-1 cells to elucidate specificity. (d) All measurable foci exhibited two-color co-localization indicating locus-specificity in female RPE-1 cells (edges of foci: < 1 voxel distance = < 50 nm3, scale bar = 500 nm, n = 4, 35 nuclei, arrowheads = CLING foci of CISTR-ACT). (e) To address resolution, two sgRNAs pools targeted XIST (yellow = MS2-mVenus) and TSIX (red = PP7-mCherry), separated by a topological associated domain (TAD) boundary; genomic linear distance ~69 kb. (f) Distinct, non-co-localized signals occurred in 6 out of 10 cells between XIST and TSIX, with spatial displacements of ∼163-638 nm in all three dimensions in RPE-1 cells (scale bar = 100 nm, arrowheads = CLING foci of XIST and TSIX).
Figure 2
Figure 2. Inter-allelic distances
(a) Inter-allelic distances of Hdac4 [CI = 2.31-3.59] on largest chromosome 1 compared to a locus on small chromosome 18 (44.21 Mb, [CI = 2.14-3.19 μm]) in female 129S1/CAST MEFs were similar (each 80 nuclei, scale bars = 5 μm, arrowheads = SNP-CLING foci of maternal and paternal Hdac4 alleles). (b) Inter-allelic distances between 129S1 and CAST alleles of loci on gene dense chromosomes (chr.7:99.55 Mb [CI = 2.48-3.96 μm], chr. 11 – Sox9 [CI = 1.82-2.75 μm]) or gene-poor chromosome 15 (Cistr-act [CI = 2.05-3.03 μm]). Chr. 11 distances were different to chr. 7 (two-tailed Mann Whitney rank sum test, * p = 0.02, each 80 nuclei, arrowheads = SNP-CLING foci of maternal and paternal Sox9 alleles). (c) Inter-allelic distances of the SNP-CLING-labeled alleles on chr.7 (arrowheads: yellow = paternal MS2-mVenus, red = maternal PP7-mCherry) relative to inter-genic distances of a CLING-labeled locus (non-allele-specific) on chr.18 (arrowheads: purple = Puf1-PUM1-iRFP670, Pearson's r2 = 0.71, significance of Pearson's: *** p < 0.0001, 80 nuclei).
Figure 3
Figure 3. Allelic distances to the nucleoli or to the nuclear periphery
(a) Examples of merged images demonstrate positioning of the studied alleles (arrowheads: red = PP7-mCherry, yellow = MS2-mVenus), and the nucleoli (rRNA-GFP) in 129S1/CAST MEFs (scale bars = 5 μm, n = 5). (b) Similar allelic distances and distributions of loci to the nucleoli (means ± SD), between 129S1 and CAST alleles in 129S1/CAST MEFs (normalized to nuclei sizes, each combination > 80 nuclei). (c) Examples of loci-nuclear periphery measurements (see panel a, n = 6, arrowheads = SNP-CLING foci). (d) Allelic distances and distributions of loci to the nuclear periphery were similar between 129S1 or CAST alleles (each combination > 80 nuclei). Allelic distances of the studied loci to the nucleoli (means ± SD) were significantly smaller, than their distances to the nuclear periphery (two-tailed Mann Whitney rank sum testing, * p < 0.05, *** p < 0.0001). (e) Spearman correlations of all allelic distances to the nucleoli (n = 620 alleles, r2 = 0.329, *** p < 0.0001) or to the nuclear periphery (r2 = 0.512, *** p < 0.0001). 61 % of 129S1 or 64 % CAST inherited loci were closer than 1 μm to the nucleolus. 35 % of 129S1 or 30 % of CAST loci were closer than 1 μm to the periphery. (f) Number of nucleoli counted in human RPE-1 or MEFs was higher in MEFs (two-tailed Mann Whitney rank sum testing, *** p < 0.0001). (g) Similar inter-nucleoli distances in human RPE-1 or MEFs (Kruskal-Wallis multiple comparisons testing [not adjusted], ns = not significant, medians with 25th to 75 th percentiles, min/max, and sample sizes [n] are depicted, RPE-1 CIlower = 3.02-3.31 μm, CIupper = 3.67-3.99 μm, MEFs CIlower = 3.06-3.35 μm, CIupper = 3.63-4.7 μm).
Figure 4
Figure 4. Firre's positioning and its inter-allelic interactions
(a) Example of CLING-labeled FIRRE loci (arrowheads: red = PP7-mCherry, 108 nuclei) and their distances to the closest nucleolus (rRNA-GFP) in female RPE-1 cells (scale bars = 5 μm). Loci-nucleoli distances revealed that FIRRE was closer to the perinucleolar space than GAPDH (107 nuclei, two-tailed Mann-Whitney rank sum test, *** p < 0.0001). (b) Example of maternal and paternal Firre alleles (arrowheads) in female 129S1 (yellow = MS2-mVenus), CAST (red = PP7-mCherry) MEFs. Firre's allelic distances to the nucleoli (129S1 CI = 0.77-1.32 μm, CAST CI = 0.81-1.38 μm) or to the nuclear periphery (80 nuclei, means ± SD, 129S1 CI = 1.38-1.84 μm, CAST CI = 1.48-1.89 μm). Firre was closer to the nucleoli than to the nuclear periphery (two-tailed Mann Whitney rank sum test, *** p < 0.0001). (c) Scheme of interacting loci between two non-homologous chromosomes in spatial proximity, targeted by SNP-CLING or CLING. (d) SNP-CLING of maternal 129S1-derived Firre (yellow = MS2-mVenus) with either Ypel4-129S1 or Ypel4-CAST (red = PP7-mCherry) in male mESCs (n = 8, arrowheads = SNP-CLING foci). (e) Allele-biased interaction of Firre with the paternal Ypel4-CAST locus (** p = 0.0012, Χ2-test, each quantification > 130 nuclei, n = 5) in male 129S1/CAST mESCs.
Figure 5
Figure 5. Firre's allelic positioning over time
(a) Scheme of 4D-imaging: individual distances, paths, and intervals of tracked signals (locus or allele) over time to address spatiotemporal loci dynamics. (b) Ratios of loci-nucleoli distances of FIRRE (n = 9) and GAPDH (n = 7) in RPE-1 cells over time. FIRRE was closer to the perinucleolar region than GAPDH (** p < 0.001, two-tailed Mann-Whitney rank sum test, means ± SEM, individual samples Figure S6a). (c) 4D-SNP-CLING: inter-allelic distances between maternal (129S1) and paternal (CAST) Firre alleles are stable over time in MEFs (means ± SD, n = 8, individual samples Figure S6b). (d) Allelic distances of maternal or paternal Firre alleles to the center of their closest nucleolus over time in MEFs (means ± SD, n = 8, individual samples Figure S6c). (e) Average speed (means ± SD, individual data points, n = 8) and (f) tortuosity (three-dimensional changes in direction) of Firre 4D-SNP-CLING in 129S1/CAST MEFs (means ± SD, individual data points, n = 64). (g) Example of 4D-SNP-CLING detecting sister-chromatids of Firre (arrowheads) during S-G2 phase and scheme of measured inter-chromatid distances and distances to the closest nucleolus (scale bar = 5 μm, n = 3). (h) Distances between chromatids over time (means ± SD, 3 cells, individual samples Figure S6d) and (i) their distances to the nucleolus in 129S1/CAST hybrid MEFs (means ± SD, 3 cells, individual samples Figure S6e). (j) 4D-SNP-CLING example and scheme of a cell undergoing apoptosis (scale bar = 5 μm, n = 5, arrowheads = SNP-CLING foci of maternal and paternal Firre alleles). (k) Inter-allelic distances (means ± SD, 5 cells, individual samples Figure S6f) and (l) Firre distances to the nucleolus showed more fluctuations in apoptotic 129S1/CAST hybrid MEFs over time (means ± SD, 5 cells, individual samples Figure S6g).

Comment in

Similar articles

Cited by

References

    1. Dekker J. Two ways to fold the genome during the cell cycle: insights obtained with chromosome conformation capture. Epigenetics Chromatin. 2014;7:25. - PMC - PubMed
    1. Lupianez DG, et al. Disruptions of topological chromatin domains cause pathogenic rewiring of gene-enhancer interactions. Cell. 2015;161:1012–25. - PMC - PubMed
    1. Dixon JR, et al. Chromatin architecture reorganization during stem cell differentiation. Nature. 2015;518:331–6. - PMC - PubMed
    1. Gorkin DU, Leung D, Ren B. The 3D genome in transcriptional regulation and pluripotency. Cell Stem Cell. 2014;14:762–75. - PMC - PubMed
    1. Jost KL, et al. Gene repositioning within the cell nucleus is not random and is determined by its genomic neighborhood. Epigenetics Chromatin. 2015;8:36. - PMC - PubMed

Methods-only References

    1. Doench JG, et al. Rational design of highly active sgRNAs for CRISPR-Cas9-mediated gene inactivation. Nat Biotechnol. 2014;32:1262–7. - PMC - PubMed
    1. Engreitz JM, et al. The Xist lncRNA exploits three-dimensional genome architecture to spread across the × chromosome. Science. 2013;341:1237973. - PMC - PubMed
    1. Huff J. The Airyscan detector from ZEISS: confocal imaging with improved signal-to-noise ratio and super-resolution. Nat Methods. 2015;12:i–ii.

Publication types