. 2018 Mar;3(3):356-366.
doi: 10.1038/s41564-017-0084-4. Epub 2018 Jan 15.

Metatranscriptome of human faecal microbial communities in a cohort of adult men

Affiliations

Metatranscriptome of human faecal microbial communities in a cohort of adult men

Galeb S Abu-Ali et al. Nat Microbiol. 2018 Mar.

Abstract

The gut microbiome is intimately related to human health, but it is not yet known which functional activities are driven by specific microorganisms' ecological configurations or transcription. We report a large-scale investigation of 372 human faecal metatranscriptomes and 929 metagenomes from a subset of 308 men in the Health Professionals Follow-Up Study. We identified a metatranscriptomic 'core' universally transcribed over time and across participants, often by different microorganisms. In contrast to the housekeeping functions enriched in this core, a 'variable' metatranscriptome included specialized pathways that were differentially expressed both across participants and among microorganisms. Finally, longitudinal metagenomic profiles allowed ecological interaction network reconstruction, which remained stable over the six-month timespan, as did strain tracking within and between participants. These results provide an initial characterization of human faecal microbial ecology into core, subject-specific, microorganism-specific and temporally variable transcription, and they differentiate metagenomically versus metatranscriptomically informative aspects of the human faecal microbiome.


Conflict of interest statement

Competing interests

The authors declare no competing financial interests.

Figures
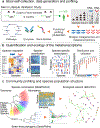
Figure 1.
Figure 1.. Metatranscriptomic and metagenomic taxonomic and functional profile of a prospective human cohort.
A) 308 participants from the Men’s Lifestyle Validation Study (MLVS), embedded within the Health Professionals Follow-up Study (HPFS) prospective cohort, provided a target of four stool samples each. These were self-collected in two pairs, six months apart, with each pair spanning 2–3 days. This yielded 929 total metagenomes and 372 metatranscriptomes, sequenced using previously published protocols and functionally profiled using HUMAnN2. B) To estimate gene family, enzyme class, and pathway relative transcription, RNA abundances were normalized to corresponding DNA abundances. We then evaluated “core” (prevalently transcribed) and variable transcriptional elements, in addition to the ecological and phylogenetic diversity of metatranscription and carriage of functional elements among species. C) Taxonomic profiles were determined using MetaPhlAn2 from both DNA and RNA data (for RNA viruses). These were also used for ecological interaction network reconstruction with BAnOCC (Schwager in review) (http://huttenhower.sph.harvard.edu/banocc) and for strain tracking with StrainPhlAn.
Figure 2.
Figure 2.. Core and variable metatranscriptomes of the stool microbiome.
DNA-normalized transcript abundances for 239 gut microbiome pathways with detectable RNA in >10 of the 341 metatranscriptomes, collected from 96 MLVS participants. Samples (columns) were sorted left to right based on decreasing number of transcribed pathways per sample. A) Core metatranscriptome pathways (transcribed in >80% of samples) with RNA:DNA transcription ratio >1. B) Low-expression core metatranscriptome pathways with transcript abundance detectable in >80% of samples but an RNA:DNA ratio <1. C) Variably metatranscribed pathways detected in DNA but below detection in at least half of RNA samples, and D) variably metatranscribed pathways below detection in DNA (and matching RNA) in 30%−80% of the 341 samples. Several pathways representative of functional categories are annotated, and the complete annotation of all pathway names and definitions are in Supplementary Fig. 6A–D. Thirty-eight pathways that did not fall into either of the four sections based on these criteria are in Supplementary Fig. 6E. The distribution range of pathways with the overall 30 highest and 30 lowest mean DNA-normalized transcript abundances among the 341 metatranscriptome samples are in Supplementary Fig. 6F. The grey color represents pathways that were below detection in both DNA and RNA in a given sample; the black color represents pathways that were detected in DNA but below detection in RNA.
Figure 3.
Figure 3.. The gut metatranscriptome is personalized and broadly taxonomically distributed.
A) Structure of the stool metagenome and metatranscriptome as contributed by diverse species. Principal coordinates analysis of pathways with microbial species’ contributions to their DNA and RNA abundances using Bray-Curtis dissimilarity, with a biplot overlay indicating centroids of abundant species’ contributions. Each pathway is thus denoted by two points, summarizing the organisms contributing them metagenomically (averaged over 913 samples from 307 participants) and metatranscriptomically (341 samples from 96 participants), and a subset of examples are labeled. The resulting joint ordination indicates broad agreement between species carrying (metagenomically) and expressing (metatranscriptomically) groups of pathways in the fecal microbiome. B) Transcription ratios of 30 pathways that were most prevalently transcribed among the top 30 species, using the same datasets as in A. Pathways for which DNA or RNA were not detected in a given species are grey. A given pathway-species combination in the heatmap represents the transcript abundance averaged over all samples that measured a non-zero RNA/DNA ratio for that species. Only pathway-species combinations in at least 5 samples (from a total of 341) were considered. Columns in the heatmap were ordered based on average linkage clustering on a Euclidean distance matrix of log2 pathway transcription ratios.
Figure 4.
Figure 4.. Transcriptional landscape of the stool microbiome.
A) Distributions of alpha diversity (Gini-Simpson index) for the species-specific metagenomic and metatranscriptomic contributions to each pathway, for 70 non-redundant pathways with the highest community level RNA abundances, averaged across 341 metatranscriptomes from 96 participants. Pathways were sorted by the sum of the median metagenomic alpha diversity and the weighted Spearman correlation from B. Boxplot whiskers represent 1.5 times the inter-quartile range from the first and third quartiles. B) Concordance of metagenomic potential with metatranscriptomic activity (metagenome-weighted mean of per-species Spearman correlations; see Methods). Metatranscriptomic diversity is, as expected, consistently lower than metagenomes, with pathways carried by only a few organisms also more differentially transcribed. Metagenomic potential (bottom) and metatranscriptomic activity (top) for example pathways with differing ecological structure, specifically C) GDP-mannose biosynthesis and D) adenosine ribonucleotide de novo biosynthesis. Abundances were normalized within each pathway for 189 subject-week pairs, from 96 participants. Subjects were ordered to emphasize blocks of subjects with similar metatranscriptomic profiles (see Methods). The top 8 (C) and top 15 (D) species in terms of their mean metatranscriptomic contribution to the pathways in C and D are shown for clarity. Examples show transcriptional ecologies that either differ strikingly from (C) or generally mirror (D) their metagenomic diversity.
Figure 5.
Figure 5.. Ecological interactions in the gut microbiome.
Significant co-variation and co-exclusion relationships among 104 species in 913 stool metagenomes from 307 MLVS participants. Each node represents a species and edges correspond to significant interactions inferred by BAnOCC (see Methods). Stool microbiome taxonomic profiles were averaged within each subject for the first and second collection pairs (separated by 6 months). Interactions in at least one time point are included here. No alternating associations (positive at one time and negative in another) were detected. 95% credible interval criteria was used to assess significance, and only estimated absolute correlations with effect sizes >=0.15 are reported. Networks for individual time points are in Supplementary Fig. 9.
Figure 6.
Figure 6.. Species-specific patterns of evolutionary divergence within species preserved across cohorts.
Panels show strain-level diversity within A) Eubacterium siraeum and B) Faecalibacterium prausnitzii. Each point represents one sample’s strain, ordinated by principal coordinate analysis of sequence dissimilarity (Kimura Two-Parameter distance). C) Pairwise nucleotide substitution rates within and between cohorts for 21 out of 30 species in Fig. 3 with sufficient prevalence in both cohorts for informative comparison. Lines represent median values, points denote outliers outside 1.5 times the interquartile range. All numbers in parenthesis are sample counts in which indicated strains were above limit of detection; from a total of 913 MLVS stool metagenomes and 553 HMP stool metagenomes (from 253 male and female HMP participants) that were analyzed with StrainPhlAn.

Similar articles

Cited by

References

    1. O’Doherty KC, Virani A & Wilcox ES The Human Microbiome and Public Health: Social and Ethical Considerations. Am J Public Health 106, 414–420, doi:10.2105/AJPH.2015.302989 (2016). - DOI - PMC - PubMed
    1. Shreiner AB, Kao JY & Young VB The gut microbiome in health and in disease. Curr Opin Gastroenterol 31, 69–75, doi:10.1097/MOG.0000000000000139 (2015). - DOI - PMC - PubMed
    1. Consortium, H. M.P. Structure, function and diversity of the healthy human microbiome. Nature 486, 207–214, doi:10.1038/nature11234 (2012). - DOI - PMC - PubMed
    1. Vatanen T et al. Variation in Microbiome LPS Immunogenicity Contributes to Autoimmunity in Humans. Cell 165, 1551, doi:10.1016/j.cell.2016.05.056 (2016). - DOI - PubMed
    1. Le Chatelier E et al. Richness of human gut microbiome correlates with metabolic markers. Nature 500, 541–546, doi:10.1038/nature12506 (2013). - DOI - PubMed

Publication types