. 2018 Apr;67(4):624-635.
doi: 10.2337/db17-0826. Epub 2018 Jan 9.

Skeletal Muscle-Specific Deletion of MKP-1 Reveals a p38 MAPK/JNK/Akt Signaling Node That Regulates Obesity-Induced Insulin Resistance

Affiliations

Skeletal Muscle-Specific Deletion of MKP-1 Reveals a p38 MAPK/JNK/Akt Signaling Node That Regulates Obesity-Induced Insulin Resistance

Ahmed Lawan et al. Diabetes. 2018 Apr.

Abstract

Stress responses promote obesity and insulin resistance, in part, by activating the stress-responsive mitogen-activated protein kinases (MAPKs), p38 MAPK, and c-Jun NH2-terminal kinase (JNK). Stress also induces expression of MAPK phosphatase-1 (MKP-1), which inactivates both JNK and p38 MAPK. However, the equilibrium between JNK/p38 MAPK and MKP-1 signaling in the development of obesity and insulin resistance is unclear. Skeletal muscle is a major tissue involved in energy expenditure and glucose metabolism. In skeletal muscle, MKP-1 is upregulated in high-fat diet-fed mice and in skeletal muscle of obese humans. Mice lacking skeletal muscle expression of MKP-1 (MKP1-MKO) showed increased skeletal muscle p38 MAPK and JNK activities and were resistant to the development of diet-induced obesity. MKP1-MKO mice exhibited increased whole-body energy expenditure that was associated with elevated levels of myofiber-associated mitochondrial oxygen consumption. miR-21, a negative regulator of PTEN expression, was upregulated in skeletal muscle of MKP1-MKO mice, resulting in increased Akt activity consistent with enhanced insulin sensitivity. Our results demonstrate that skeletal muscle MKP-1 represents a critical signaling node through which inactivation of the p38 MAPK/JNK module promotes obesity and insulin resistance.


Figures

Figure 1
Figure 1
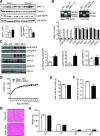
Generation and characterization of mice with skeletal muscle–specific deletion of MKP-1. A: MKP-1 protein expression and phospho- (p)p38 MAPK/p38 MAPK from skeletal muscles of lean (BMI <25 kg/m2) and obese (BMI <30 kg/m2) human subjects (n = 7). B: Mkp-1fl/fl and MKP1-MKO genotyping (top panel) and MKP-1 mRNA expression from various tissues in chow-fed Mkp-1fl/fl and MKP1-MKO mice (bottom panel) (n = 8–10). C: Immunoblots of skeletal muscle lysates from chow-fed Mkp-1fl/fl and MKP1-MKO mice for pp38 MAPK, pJNK1/2, and pERK1/2 normalized to corresponding total MAPKs (left panel). Immunoblots were quantitated by densitometry (right panels). Weight curves (D), total body lean mass (E), and total body fat mass (F). Hematoxylin and eosin staining of skeletal muscle sections (G) and skeletal muscle weights (H) of chow-fed male Mkp-1fl/fl and MKP1-MKO mice. Scale bars: 100 μm. Results represent n = 8/genotype, and data shown are the mean ± SEM. *P < 0.05; **P < 0.01 as determined by Student t test. White bars, Mkp-1fl/fl mice; black bars, MKP1-MKO mice. EDL, extensor digitorum longus; GA, gastrocnemius; SO, soleus; TA, tibialis anterior; WAT, white adipose tissue; WT, wild-type.
Figure 2
Figure 2
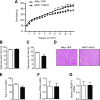
Resistance to diet-induced obesity in MKP1-MKO mice. A: Weight curves of HFD-fed male Mkp-1fl/fl and MKP1-MKO mice for 18 weeks. Spectroscopic analysis of total body lean mass (B) and fat mass (C) from HFD-fed Mkp-1fl/fl and MKP1-MKO mice (n = 9 to 10/genotype). D: Representative hematoxylin and eosin staining of skeletal muscle sections from HFD-fed Mkp-1fl/fl and MKP1-MKO mice. Scale bars: 100 μm. E: Serum triglycerides (TG) from HFD-fed Mkp-1fl/fl and MKP1-MKO mice (n = 6/genotype). Skeletal muscle mRNA expression of PPARG (F) and SREBP1C (G) from HFD-fed Mkp-1fl/fl and MKP1-MKO mice (n = 6/genotype). Data represent mean ± SEM. **P < 0.01; ***P < 0.0001 as determined by Student t test or in ANOVA with Bonferroni posttest for multiple comparisons (A). White bars, Mkp-1fl/fl mice; black bars, MKP1-MKO mice.
Figure 3
Figure 3
Increased whole-body energy expenditure in MKP1-MKO mice. A–F: Chow-fed Mkp-1fl/fl and MKP1-MKO mice were subjected to open circuit calorimetry. Energy expenditure (A), oxygen consumption (B), carbon dioxide production (C), RER (D), feeding (E), and locomotor activity (F) (n = 8/genotype). Data represent mean ± SEM. *P < 0.05 as determined by Student t test. White bars, Mkp-1fl/fl mice; black bars, MKP1-MKO mice.
Figure 4
Figure 4
Protection from hepatosteatosis in MKP1-MKO mice. A: Representative hematoxylin and eosin (H & E) and Oil Red O staining of liver sections from HFD-fed Mkp-1fl/fl and MKP1-MKO mice. Scale bars: 100 μm. B: Liver to body weight ratio of HFD-fed Mkp-1fl/fl and MKP1-MKO mice (n = 9 to 10/genotype). C: Hepatic triglycerides (TG) from chow- and HFD-fed Mkp-1fl/fl and MKP1-MKO mice (n = 5 to 6/genotype). Hepatic mRNA expression of PPARG (D) and SREBP1C (E) from HFD-fed Mkp-1fl/fl and MKP1-MKO mice (n = 6/genotype). Liver lysates from HFD-fed Mkp-1fl/fl and MKP1-MKO mice were analyzed by immunoblotting for phospho-(p)p38 MAPK, pJNK1/2, and pERK1/2 shown with corresponding total MAPK (F) and pAkt and p-p70 S6K shown with corresponding Akt and p70 S6K totals (G). Results represent n = 5/genotype. Data represent mean ± SEM. *P < 0.05; **P < 0.01, as determined by Student t test. White bars, Mkp-1fl/fl mice; black bars, MKP1-MKO mice.
Figure 5
Figure 5
Insulin sensitivity in HFD-fed MKP1-MKO mice. Basal plasma glucose concentration in chow- and HFD-fed Mkp-1fl/fl and MKP1-MKO mice (A) and plasma insulin concentration in fed and overnight-fasted chow-fed Mkp-1fl/fl and MKP1-MKO mice (n = 8–10/genotype) (B). Plasma glucose concentration during GTTs (C) and ITTs (D) in overnight-fasted chow Mkp-1fl/fl and MKP1-MKO mice. GTT (E) and plasma insulin during GTT (F) and ITT (G) analyses in HFD-fed Mkp-1fl/fl and MKP1-MKO mice. Data represent n = 8–10/genotype. Mean ± SEM. *P < 0.05; **P < 0.01; ***P < 0.0001 as determined by Student t test and in C–F by ANOVA with Bonferroni posttest for multiple comparisons. White bars, Mkp-1fl/fl mice; black bars, MKP1-MKO mice.
Figure 6
Figure 6
Enhanced MAPK and Akt signaling in skeletal muscle of HFD-fed MKP1-MKO mice. Skeletal muscle lysates from HFD-fed Mkp-1fl/fl and MKP1-MKO mice were analyzed by immunoblotting. Immunoblots were quantitated by densitometry for the levels of phospho-(p)p38 MAPK, pJNK1/2, and pERK1/2 normalized to corresponding total MAPKs (A) and pAkt and p-p70 S6K shown with corresponding Akt and p70 S6K totals (B). Results represent n = 5/genotype, and data shown are the mean ± SEM. **P < 0.01; ***P < 0.0001 as determined by Student t test. White bars, Mkp-1fl/fl mice; black bars, MKP1-MKO mice.
Figure 7
Figure 7
Skeletal muscle MKP-1 regulates Akt activity through PTEN/miR-21 in HFD-fed MKP1-MKO mice. A: Immunoblots from skeletal muscle of HFD-fed Mkp-1fl/fl and MKP1-MKO mice were immunoblotted for PTEN and ERK1/2, and densitometric quantitation of immunoblots is shown. B: Skeletal muscle and hepatic mRNA expression of pri-miR-21 and mature miR-21 from HFD-fed Mkp-1fl/fl and MKP1-MKO mice. Results represent n = 5 and 10/genotype for skeletal muscle and liver, respectively. C: C2C12 myoblasts were transfected with vector or constitutively active mutants of MKK6 (EE), MKK4 (EE), and MEK1. C2C12 myoblasts were analyzed for miR-21 expression or immunoblotted for phospho-(p)p38 MAPK, pJNK, and pERK1/2 with corresponding MAPK totals (n = 3). Data shown are the mean ± SEM. *P < 0.05; **P < 0.01 as determined by Student t test. White bars, Mkp-1fl/fl mice; black bars, MKP1-MKO mice.
Figure 8
Figure 8
Enhanced skeletal muscle oxidative capacity, mitochondrial gene expression, and endurance in MKP1-MKO mice. Percentage of fiber type from soleus (A) and tibialis anterior (B) in chow- and HFD-fed Mkp-1fl/fl and MKP1-MKO mice (n = 6/genotype). mRNA expression of mitochondrial genes from chow-fed (C) and HFD-fed (D) Mkp-1fl/fl and MKP1-MKO mice (n = 6/genotype). E: Mitochondrial respiratory control ration (RCR) in chow- and HFD-fed Mkp-1fl/fl and MKP1-MKO mice (n = 6/genotype). F: mtDNA in chow- and HFD-fed Mkp-1fl/fl and MKP1-MKO mice (n = 5/genotype). Parameters during endurance exercise show in VO2max (G), distance run during endurance exercise (H), and total body fat mass after exercise (I) in chow-fed Mkp-1fl/fl and MKP1-MKO mice (n = 7/genotype). Data represent mean ± SEM. *P < 0.05; **P < 0.01; ***P < 0.0001 as determined by as determined by Student t test. White bars, Mkp-1fl/fl mice; black bars, MKP1-MKO mice.

Similar articles

Cited by

References

    1. Bassel-Duby R, Olson EN. Signaling pathways in skeletal muscle remodeling. Annu Rev Biochem 2006;75:19–37 - PubMed
    1. Zierath JR, Hawley JA. Skeletal muscle fiber type: influence on contractile and metabolic properties. PLoS Biol 2004;2:e348. - PMC - PubMed
    1. Semenkovich CF. Insulin resistance and atherosclerosis. J Clin Invest 2006;116:1813–1822 - PMC - PubMed
    1. Samuel VT, Shulman GI. Mechanisms for insulin resistance: common threads and missing links. Cell 2012;148:852–871 - PMC - PubMed
    1. Schiaffino S, Reggiani C. Fiber types in mammalian skeletal muscles. Physiol Rev 2011;91:1447–1531 - PubMed

Publication types