

Structure of the Nanobody-Stabilized Active State of the Kappa Opioid Receptor
- PMID: 29307491
- PMCID: PMC5802374
- DOI: 10.1016/j.cell.2017.12.011
Structure of the Nanobody-Stabilized Active State of the Kappa Opioid Receptor
Abstract
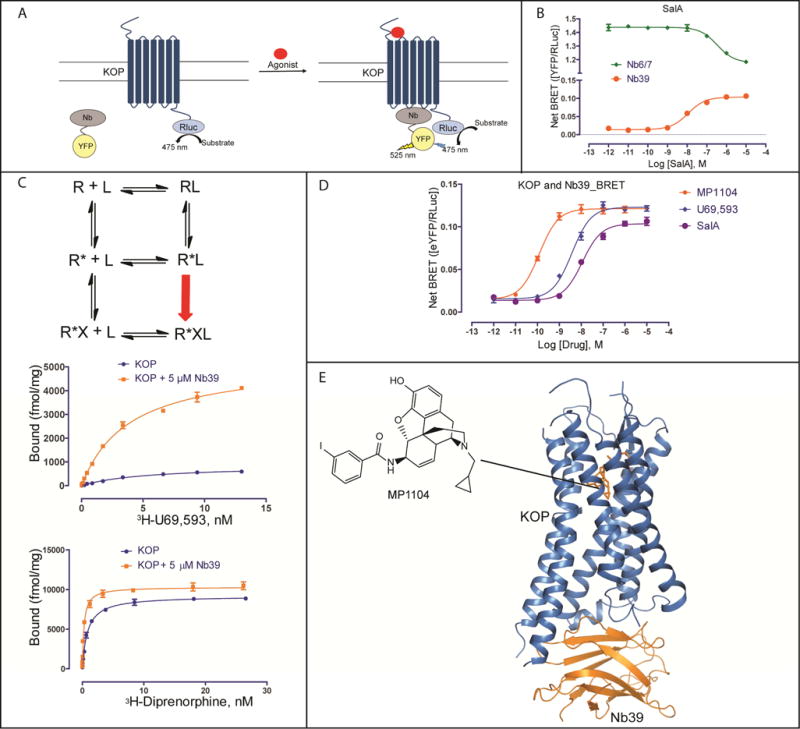
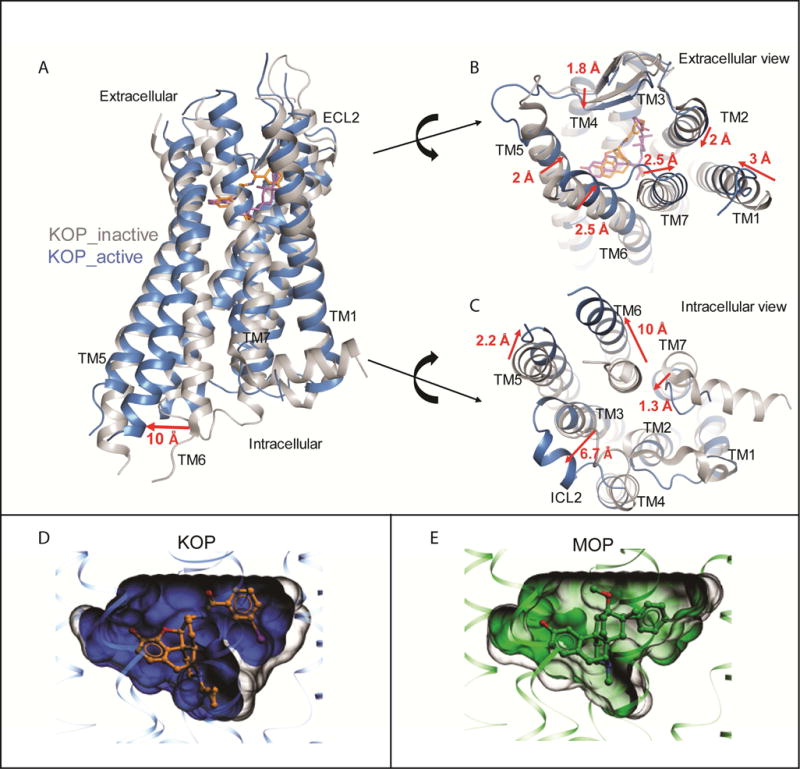
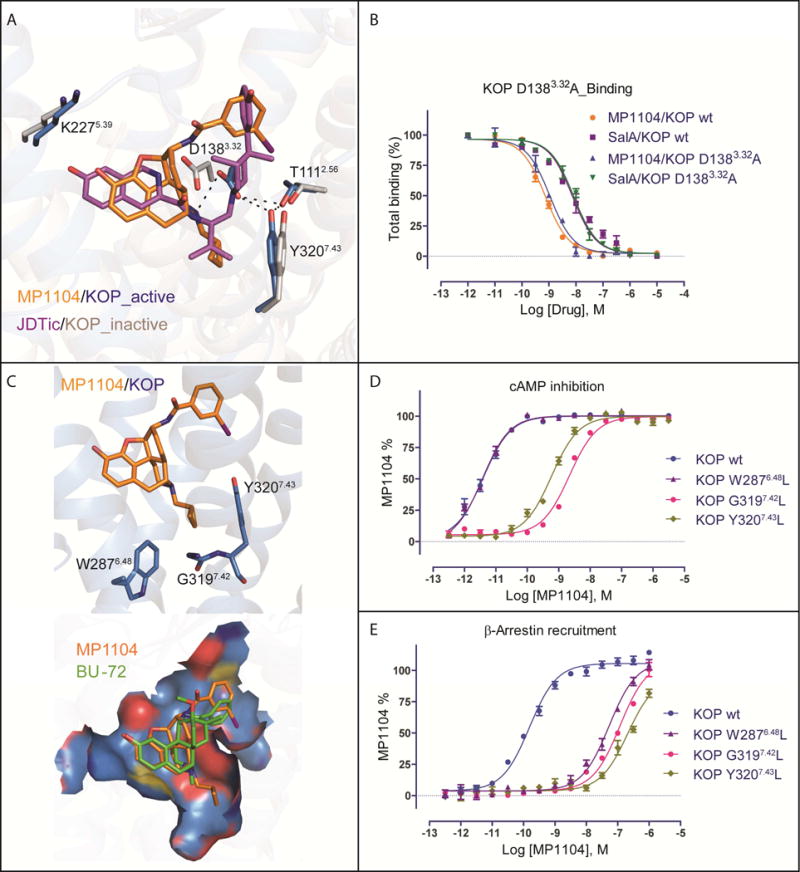
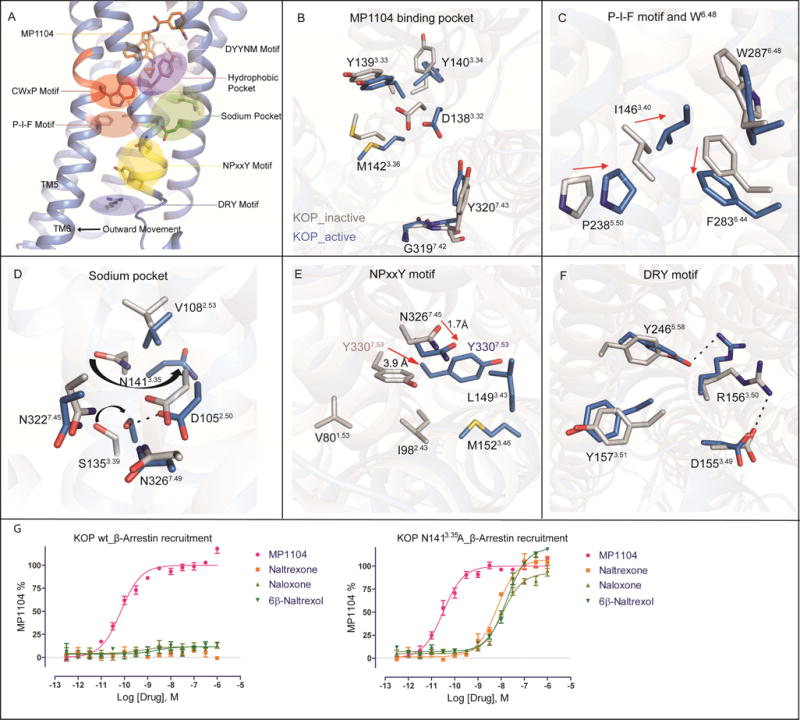
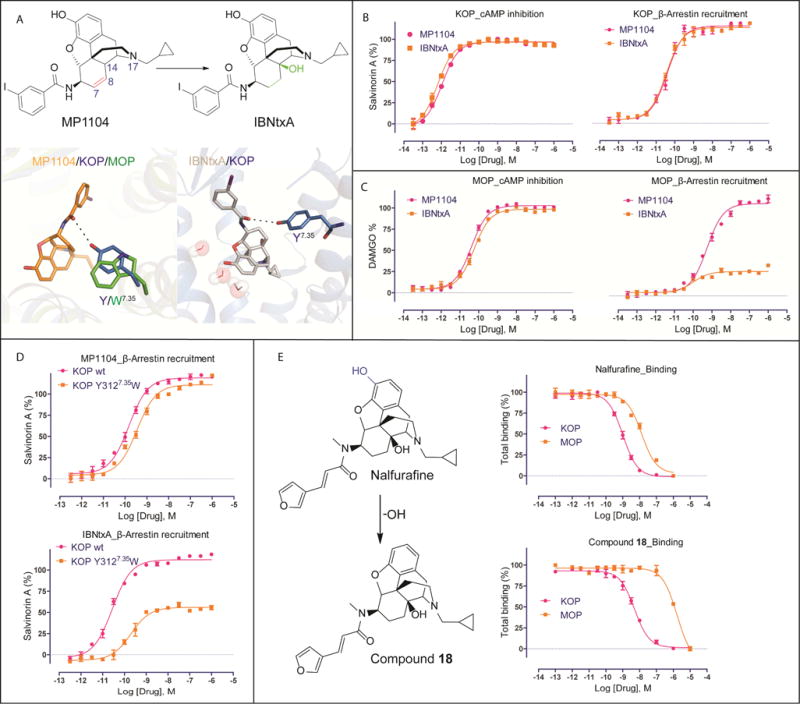
The κ-opioid receptor (KOP) mediates the actions of opioids with hallucinogenic, dysphoric, and analgesic activities. The design of KOP analgesics devoid of hallucinatory and dysphoric effects has been hindered by an incomplete structural and mechanistic understanding of KOP agonist actions. Here, we provide a crystal structure of human KOP in complex with the potent epoxymorphinan opioid agonist MP1104 and an active-state-stabilizing nanobody. Comparisons between inactive- and active-state opioid receptor structures reveal substantial conformational changes in the binding pocket and intracellular and extracellular regions. Extensive structural analysis and experimental validation illuminate key residues that propagate larger-scale structural rearrangements and transducer binding that, collectively, elucidate the structural determinants of KOP pharmacology, function, and biased signaling. These molecular insights promise to accelerate the structure-guided design of safer and more effective κ-opioid receptor therapeutics.
Keywords: GPCR; active state; addiction; crystallography; morphinan; nanobody; opioid receptor; structure-function.
Copyright © 2017 Elsevier Inc. All rights reserved.
Figures
Similar articles
-
The atomistic level structure for the activated human κ-opioid receptor bound to the full Gi protein and the MP1104 agonist.Proc Natl Acad Sci U S A. 2020 Mar 17;117(11):5836-5843. doi: 10.1073/pnas.1910006117. Epub 2020 Mar 3. Proc Natl Acad Sci U S A. 2020. PMID: 32127473 Free PMC article.
-
Controlling opioid receptor functional selectivity by targeting distinct subpockets of the orthosteric site.Elife. 2021 Feb 8;10:e56519. doi: 10.7554/eLife.56519. Elife. 2021. PMID: 33555255 Free PMC article.
-
Mechanistic Characterization of the Pharmacological Profile of HS-731, a Peripherally Acting Opioid Analgesic, at the µ-, δ-, κ-Opioid and Nociceptin Receptors.Molecules. 2022 Jan 28;27(3):919. doi: 10.3390/molecules27030919. Molecules. 2022. PMID: 35164182 Free PMC article.
-
Morphinan Evolution: The Impact of Advances in Biochemistry and Molecular Biology.J Biochem. 2024 Mar 25;175(4):337-355. doi: 10.1093/jb/mvae021. J Biochem. 2024. PMID: 38382631 Review.
-
Kappa opioids and the modulation of pain.Psychopharmacology (Berl). 2010 Jun;210(2):109-19. doi: 10.1007/s00213-010-1819-6. Epub 2010 Apr 7. Psychopharmacology (Berl). 2010. PMID: 20372880 Review.
Cited by
-
Neuroscience in addiction research.J Neural Transm (Vienna). 2024 May;131(5):453-459. doi: 10.1007/s00702-023-02713-7. Epub 2023 Nov 10. J Neural Transm (Vienna). 2024. PMID: 37947883 Review.
-
Finding the Perfect Fit: Conformational Biosensors to Determine the Efficacy of GPCR Ligands.ACS Pharmacol Transl Sci. 2022 Aug 14;5(9):694-709. doi: 10.1021/acsptsci.1c00256. eCollection 2022 Sep 9. ACS Pharmacol Transl Sci. 2022. PMID: 36110374 Free PMC article. Review.
-
A Structure-Activity Relationship Comparison of Imidazodiazepines Binding at Kappa, Mu, and Delta Opioid Receptors and the GABAA Receptor.Molecules. 2020 Aug 25;25(17):3864. doi: 10.3390/molecules25173864. Molecules. 2020. PMID: 32854311 Free PMC article.
-
The opioid receptor: emergence through millennia of pharmaceutical sciences.Front Pain Res (Lausanne). 2023 Nov 1;4:960389. doi: 10.3389/fpain.2023.960389. eCollection 2023. Front Pain Res (Lausanne). 2023. PMID: 38028425 Free PMC article. Review.
-
Structural Characterization of KOR Inactive and Active States for 3D Pharmacology and Drug Discovery.Handb Exp Pharmacol. 2022;271:41-64. doi: 10.1007/164_2021_461. Handb Exp Pharmacol. 2022. PMID: 33945028 Review.
References
-
- Abagyan R, Totrov M, Kuznetsov D. Icm – a New Method for Protein Modeling and Design – Applications to Docking and Structure Prediction from the Distorted Native Conformation. Journal of Computational Chemistry. 1994;15:488–506.
-
- Black JW, Leff P. Operational Models of Pharmacological Agonism. Proc R Soc Ser B-Bio. 1983;220:141–162. - PubMed
Publication types
MeSH terms
Substances
Grants and funding
- R01 DA027170/DA/NIDA NIH HHS/United States
- P30 CA016086/CA/NCI NIH HHS/United States
- R01 DA017204/DA/NIDA NIH HHS/United States
- P30 CA008748/CA/NCI NIH HHS/United States
- R01 MH061887/MH/NIMH NIH HHS/United States
- R21 DA038858/DA/NIDA NIH HHS/United States
- U19 MH082441/MH/NIMH NIH HHS/United States
- R33 DA038858/DA/NIDA NIH HHS/United States
- R33 DA034106/DA/NIDA NIH HHS/United States
- R01 DA006241/DA/NIDA NIH HHS/United States
- R21 DA034106/DA/NIDA NIH HHS/United States
- P01 DA035764/DA/NIDA NIH HHS/United States
LinkOut - more resources
Full Text Sources
Other Literature Sources
Molecular Biology Databases
