. 2018 Jan 4;22(1):78-90.e4.
doi: 10.1016/j.stem.2017.11.020.

Endogenous Reprogramming of Alpha Cells into Beta Cells, Induced by Viral Gene Therapy, Reverses Autoimmune Diabetes

Affiliations

Endogenous Reprogramming of Alpha Cells into Beta Cells, Induced by Viral Gene Therapy, Reverses Autoimmune Diabetes

Xiangwei Xiao et al. Cell Stem Cell. .

Abstract

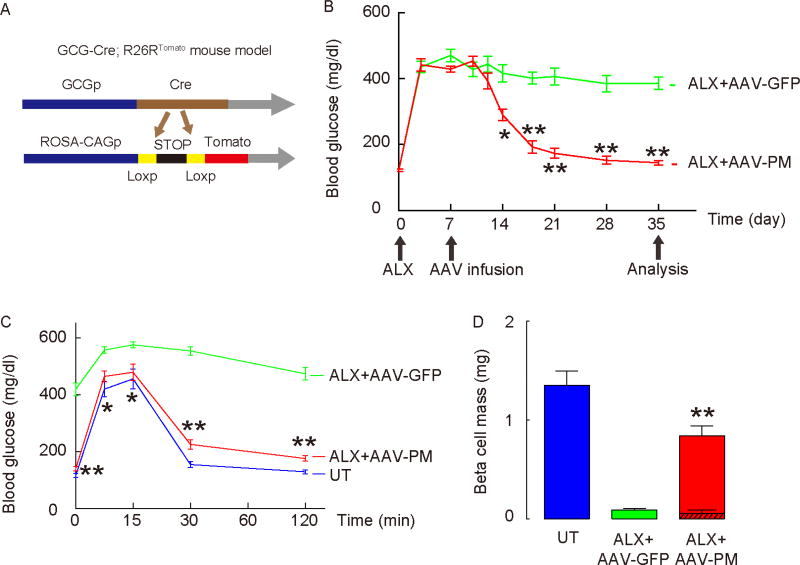
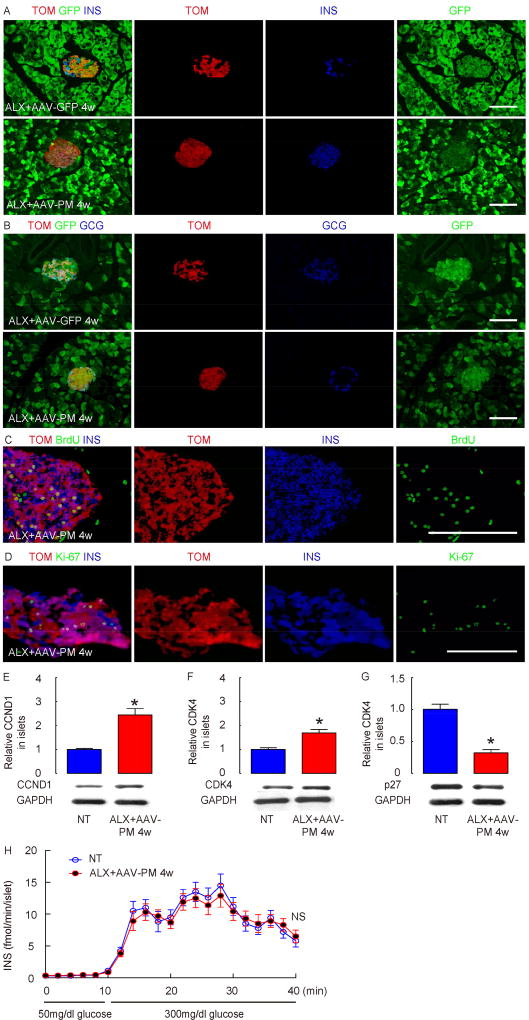
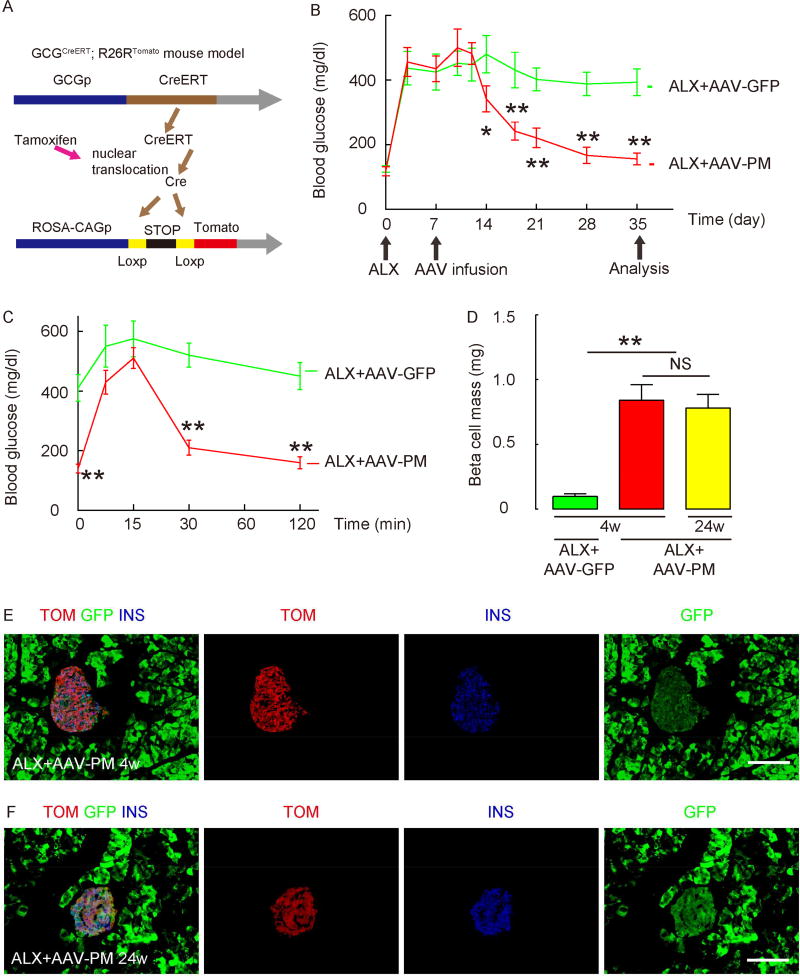
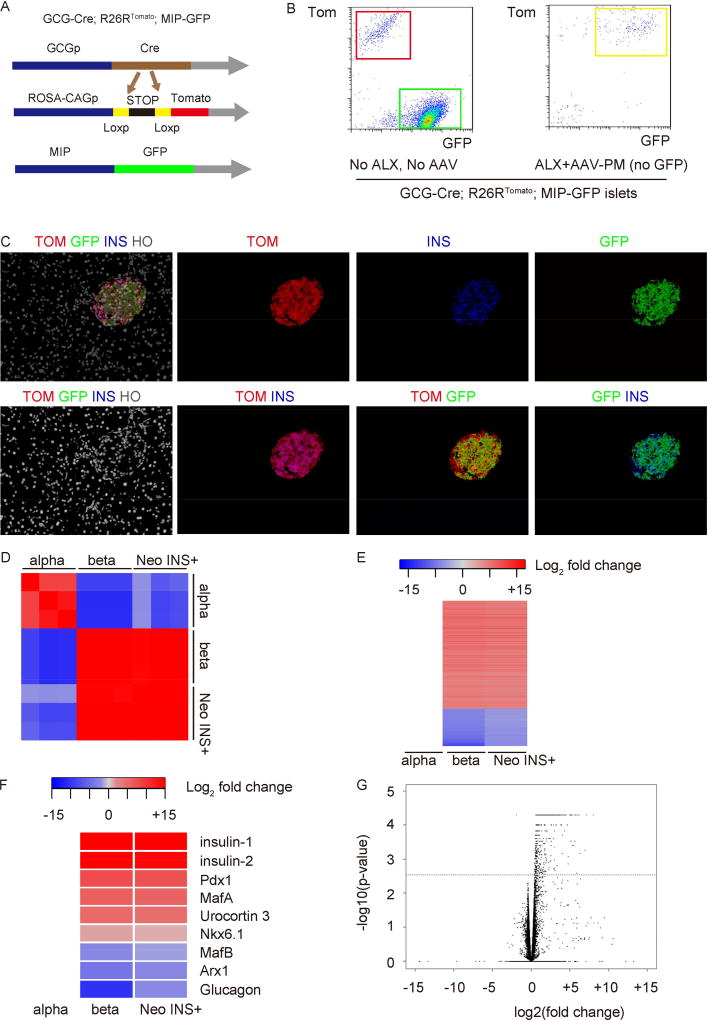
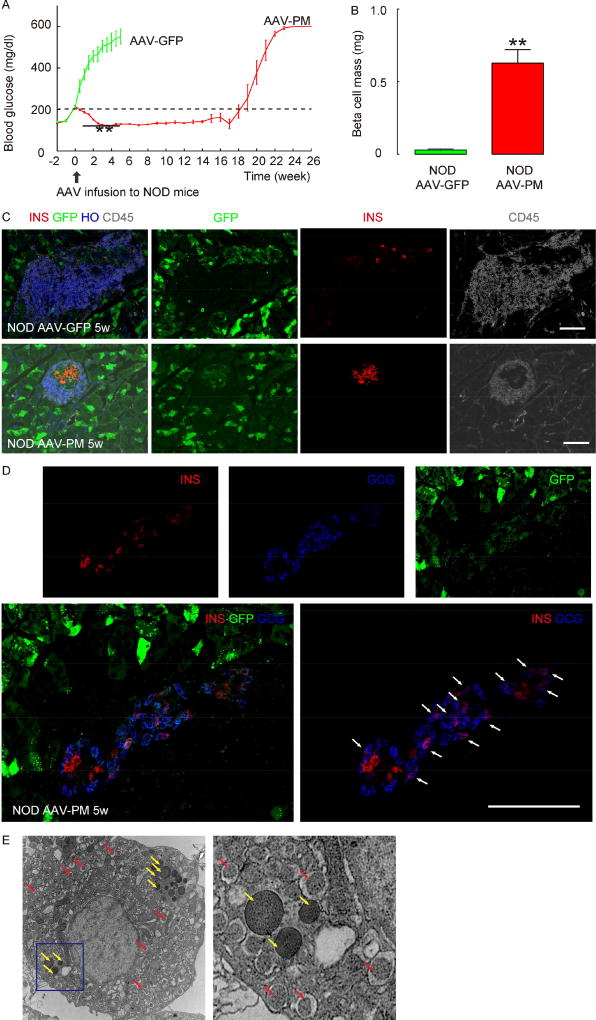
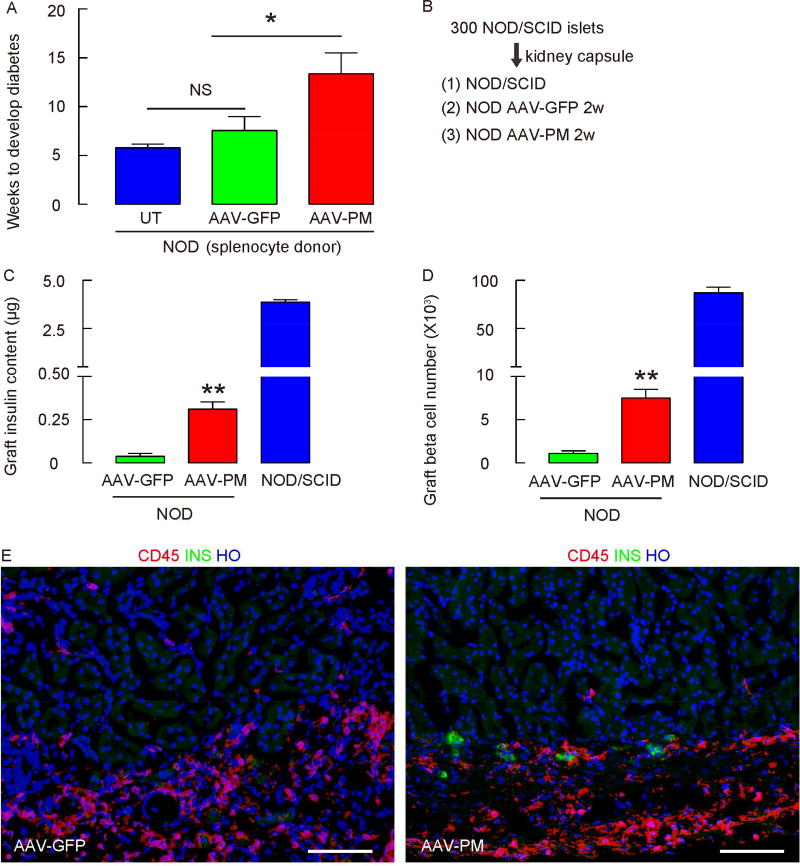
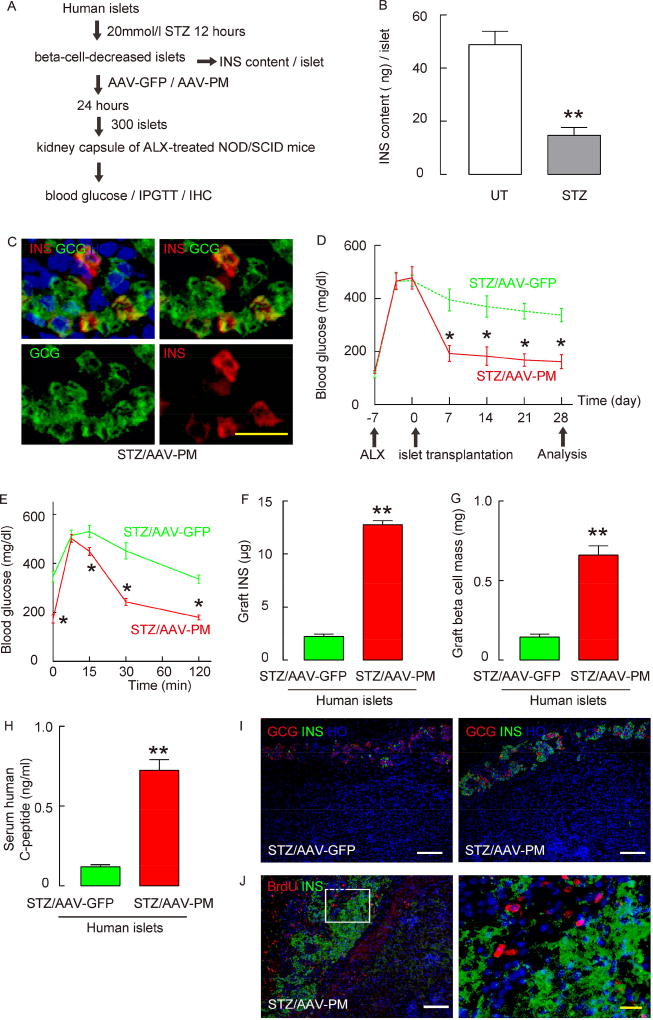
Successful strategies for treating type 1 diabetes need to restore the function of pancreatic beta cells that are destroyed by the immune system and overcome further destruction of insulin-producing cells. Here, we infused adeno-associated virus carrying Pdx1 and MafA expression cassettes through the pancreatic duct to reprogram alpha cells into functional beta cells and normalized blood glucose in both beta cell-toxin-induced diabetic mice and in autoimmune non-obese diabetic (NOD) mice. The euglycemia in toxin-induced diabetic mice and new insulin+ cells persisted in the autoimmune NOD mice for 4 months prior to reestablishment of autoimmune diabetes. This gene therapy strategy also induced alpha to beta cell conversion in toxin-treated human islets, which restored blood glucose levels in NOD/SCID mice upon transplantation. Hence, this strategy could represent a new therapeutic approach, perhaps complemented by immunosuppression, to bolster endogenous insulin production. Our study thus provides a potential basis for further investigation in human type 1 diabetes.

Keywords: MafA; NOD; Pdx1; adoptive transfer; alpha cells; beta cells; human islets; intraductal viral infusion; islet transplantation; lineage tracing.


Conflict of interest statement

Conflict of interest:

Xiangwei Xiao, Ping Guo and George Gittes have a US national phase patent pending for intra-pancreatic ductal delivery of reagents through endoscopic retrograde cholangiopancreatography. PCT Application No. PCT/US2015/026532.

Figures

Figure 1
Figure 1. Intraductal infusion of AAV-PM corrects ALX-induced hyperglycemia in GCG-Cre; R26RTomato mice
(A) Schematic for the generation of GCG-Cre; R26RTomato mice. (B) Hyperglycemia was induced in GCG-Cre; R26RTomato mice by ALX injection. One week after ALX treatment, mice received a pancreatic intraductal infusion of either AAV-PM (red line) or control AAV-GFP (green line). Fasting blood glucose levels were measured. (C) IPGTT was performed in these mice 4 weeks after viral infusion. Untreated mice (no ALX, no virus, in blue) were used as an additional control. (D) Beta cell mass at 4 weeks after virus infusion. The contribution of INS+ cells without tomato red fluorescence is shown by the hatched bar contained within the red bar, compared to the beta cell mass in mice that received AAV-GFP viral infusion (green bar), and the beta cell mass of untreated mice (UT, no ALX, no virus, blue bar). Statistics were analyzed by one-way ANOVA with a Bonferroni correction, followed by Fisher’s Exact Test. Data are presented as mean±S.D. *: p<0.05. **: p<0.01. N=10. Scale bars are 50µm.
Figure 2
Figure 2. Neogenic INS+ cells are derived from reprogrammed alpha cells
(A) Immunostaining for INS after infusion of control AAV-GFP (upper panels) or AAV-PM (lower panels) in ALX-treated GCG-Cre; R26RTomato mice, along with direct fluorescence for tomato (TOM, from GCG-Cre activity) and for green fluorescence (GFP, from viral infection). Both AAV-GFP and AAV-PM viruses carry a GFP cassette. (B) Immunostaining for GCG from a region nearby to (A) after infusion of control AAV-GFP (upper panels) or AAV-PM (lower panels) in ALX-treated GCG-Cre; R26RTomato mice, along with direct fluorescence for tomato (TOM, from GCG-Cre activity) and for green fluorescence (GFP, from viral infection). (C–D) BrdU was continuously provided in the drinking water during the 4 weeks after viral infusion. Immunostaining for BrdU (C) or Ki-67 (D), INS and TOM in ALX-treated, AAV-PM-infused GCG-Cre; R26RTomato mice. (E–G) Western blot for CyclinD1 (CCND1; E), CDK4 (F) and p27 (G) in islets from ALX-treated, AAV-PM-infused mice, compared to control untreated islets (NT, no ALX, no AAV). (F) Perifusion studies of islets from ALX-treated, AAV-PM-infused mice, compared to NT islets. Statistics were analyzed by one-way ANOVA with a Bonferroni correction, followed by Fisher’s Exact Test. Data are presented as mean±S.D. NS: non-significant. N=5. Scale bars are 20µm.
Figure 3
Figure 3. Intraductal infusion of AAV-PM corrects ALX-induced hyperglycemia in GCGCreERT; R26RTomato mice
(A) Schematic for the generation of GCGCreERT; R26RTomato mice. (B) One week after tamoxifen administration, hyperglycemia was induced in GCGCreERT; R26RTomato mice by ALX injection. One week after ALX treatment, mice received a pancreatic intraductal infusion of either AAV-PM (red line) or control AAV-GFP (green line). Fasting blood glucose levels were measured. (C) IPGTT was performed in these mice 4 weeks after viral infusion. (D) Beta cell mass at 4 weeks and 24 weeks after virus infusion. (E–F) Immunostaining for INS after infusion of AAV-PM in ALX-treated GCGCreERT; R26RTomato mice, along with direct fluorescence for tomato (Cre-activity) and for green fluorescence (GFP, from viral infection) at 4 weeks (E) and 24 weeks (F) after virus infusion. Statistics were analyzed by one-way ANOVA with a Bonferroni correction, followed by Fisher’s Exact Test. Data are presented as mean±S.D. *: p<0.05. **: p<0.01. NS: non-significant. N=5. Scale bars are 50µm.
Fig 4
Fig 4. Gene expression pattern of alpha-cell-derived INS+ cells, compared to normal alpha and beta cells
(A) Schematic of GCG-Cre; R26RTomato; MIP-GFP mouse model. (B) Alpha-cell-derived INS+ cells (yellow cells) were isolated 1 month after AAV-PM infusion from ALX-treated GCG-Cre; R26RTomato; MIP-GFP mice, based on expression of tomato red (alpha-cell lineage) and GFP by flow cytometry. Sorted normal GFP+ beta cells and normal TOM+ alpha cells from GCG-Cre; R26RTomato; MIP-GFP mice without any treatment were used as controls. Representative flow cytometry chart for sorting is shown. (C) Immunofluorescence images from the GCG-Cre; R26RTomato; MIP-GFP mouse 4 weeks after ALX/AAV-PM infusion. Note the abundance of the TOM+GFP+ INS+ (yellow) cells. N=5. (D–F) Gene expression analysis of these alpha cell-derived INS+ cells (Neo INS+) was performed by RNA-seq, and compared to purified, normal beta (beta) and alpha (alpha) cells. (D) Pearson correlation plot showing the FPKM values of all genes generated by Cuffnorm for all samples followed by heat map generation using the Pearson correlation R2 values. (E) Heat map shows log2 fold change (adjusted p value <0.05, absolute fold change +/− 2.0). (F) Selected beta-cell-specific and alpha-cell-specific genes show close alignment of the Neo-INS+ cells with beta cells, not alpha cells by RNA-seq. (G) Volcano plot for the group B versus group C comparison, of – log10(p-value) vs. log2(fold change), for differential gene expression analysis using Cuffdiff output. The horizontal dashed line in both plots corresponds to an FDR adjusted p-value of 0.01. All points displayed above this this line on the plot have an adjusted p-value of less than 0.01. N=3. For each sample, purified cells from 4–5 mouse pancreases were pooled together for RNA-seq.
Figure 5
Figure 5. Intraductal infusion of AAV-PM reverses hyperglycemia in NOD mice
(A) When the blood glucose of female NOD mice surpassed 200mg/dl, the mice received an intraductal infusion of either AAV-PM or control AAV-GFP. Fasting blood glucose levels were measured, showing continuously increasing hyperglycemia in control mice (green line), but rapid stabilization and then, by 2–3 weeks, normalization of hyperglycemia in mice infused with AAV-PM (red line), lasting for about 4 months. (B) Beta cell mass at 5 weeks after viral infusion. (C) Immunostaining for INS (in red) and CD45 (in white) 5 weeks after infusion of control AAV-GFP (upper panels) or AAV-PM (lower panels), along with direct green fluorescence (GFP) from viral infection. HO: Hoechst, nuclear stain. (D) Confocal images for INS (in red) and GCG (in blue) 5 weeks after infusion of AAV-PM, along with direct green fluorescence (GFP) from viral infection, to show presence of double positive cells for both INS and GCG (arrows). (E) EM image showing an islet cell with both INS (red arrow) and GCG (yellow arrow) granules in the left panel. The right panel is the inset of the blue rectangle region in the left panel. Statistics were analyzed by one-way ANOVA with a Bonferroni correction, followed by Fisher’s Exact Test. Data are presented as mean±S.D. **: p<0.01. N=10. Scale bars are 50µm.
Figure 6
Figure 6. Assessment of the status of the NOD autoimmunity following viral therapy
(A) Splenocytes isolated from untreated diabetic NOD mice (UT), and from AAV-PM-infused and AAV-GFP- infused NOD mice 4 weeks after viral infusion were adoptively transferred into NOD/SCID mice. The development of diabetes in recipient NOD/SCID mice was compared. (B) NOD/SCID mouse islets (300) were transplanted under the kidney capsule of AAV-PM-treated and AAV-GFP-treated NOD mice 4 weeks after viral infusion, and into undisturbed NOD/SCID mice as a control. (C–D) Quantification of graft INS content (C) and INS+ cell number (D) 2 weeks after transplantation. (E) Representative images for INS (in green) and CD45 (in red) in the islet graft under the kidney capsule. Statistics were analyzed by one-way ANOVA with a Bonferroni correction, followed by Fisher’s Exact Test. Data are presented as mean±S.D. *: p<0.05. **: p<0.01. N=5. Scale bars are 50µM.
Figure 7
Figure 7. AAV-PM induces generation of functional INS+ cells in human islets
(A) Human islets were treated with 20 mmol/l STZ for 12 hours, after which the islets were treated with either AAV-PM or AAV-GFP for 24 hours, and then transplanted into ALX-treated hyperglycemic NOD/SCID mice. (B) The beta-cell-destroying effect of STZ was confirmed at 12 hours by examining INS content per islet. (C) Immunostaining for INS and GCG on human islets 2 days after treatment with STZ and AAV-PM. (D–E) The ALX-NOD/SCID mice that received human islets treated with STZ and AAV-PM (in red) had significantly lower fasting blood glucose levels (D), and significantly better glucose tolerance (E), as early as 1 week after transplantation, compared to the ALX-NOD/SCID mice that received human islets treated with STZ and AAV-GFP (in green). (F–H) Graft INS content (F), graft beta cell mass (G) and serum human C-peptide levels (H) were determined 4 weeks after transplantation. (I) Representative images for INS (in green) and GCG (in red) in the graft under the kidney capsule. (J) One week of continuous BrdU labeling was performed after the islet transplantation, only 1.5±0.3% of INS+ cells had incorporated BrdU, shown by a representative image in the left panel. The right panel is an inset of the yellow rectangle region in the left panel. Statistics were analyzed by one-way ANOVA with a Bonferroni correction, followed by Fisher’s Exact Test. Data are presented as mean±S.D. *: p<0.05. **: p<0.01. N=5. White scale bars are 50µM. Yellow scale bars are 20µM.

Comment in

Similar articles

Cited by

References

    1. Ackermann AM, Gannon M. Molecular regulation of pancreatic beta-cell mass development, maintenance, and expansion. J Mol Endocrinol. 2007;38:193–206. - PubMed
    1. Ackermann AM, Wang Z, Schug J, Naji A, Kaestner KH. Integration of ATAC-seq and RNA-seq identifies human alpha cell and beta cell signature genes. Mol Metab. 2016;5:233–244. - PMC - PubMed
    1. Akinci E, Banga A, Greder LV, Dutton JR, Slack JM. Reprogramming of pancreatic exocrine cells towards a beta (beta) cell character using Pdx1, Ngn3 and MafA. Biochem J. 2012;442:539–550. - PMC - PubMed
    1. Atkinson MA, Leiter EH. The NOD mouse model of type 1 diabetes: as good as it gets? Nat Med. 1999;5:601–604. - PubMed
    1. Baeyens L, Lemper M, Leuckx G, De Groef S, Bonfanti P, Stange G, Shemer R, Nord C, Scheel DW, Pan FC, et al. Transient cytokine treatment induces acinar cell reprogramming and regenerates functional beta cell mass in diabetic mice. Nat Biotechnol. 2014;32:76–83. - PMC - PubMed

Publication types

MeSH terms