. 2018 Jan 4;9(1):55.
doi: 10.1038/s41467-017-02490-4.

Short-chain fatty acids regulate systemic bone mass and protect from pathological bone loss

Affiliations

Short-chain fatty acids regulate systemic bone mass and protect from pathological bone loss

Sébastien Lucas et al. Nat Commun. .

Abstract

Microbial metabolites are known to modulate immune responses of the host. The main metabolites derived from microbial fermentation of dietary fibers in the intestine, short-chain fatty acids (SCFA), affect local and systemic immune functions. Here we show that SCFA are regulators of osteoclast metabolism and bone mass in vivo. Treatment of mice with SCFA as well as feeding with a high-fiber diet significantly increases bone mass and prevents postmenopausal and inflammation-induced bone loss. The protective effects of SCFA on bone mass are associated with inhibition of osteoclast differentiation and bone resorption in vitro and in vivo, while bone formation is not affected. Mechanistically, propionate (C3) and butyrate (C4) induce metabolic reprogramming of osteoclasts resulting in enhanced glycolysis at the expense of oxidative phosphorylation, thereby downregulating essential osteoclast genes such as TRAF6 and NFATc1. In summary, these data identify SCFA as potent regulators of osteoclast metabolism and bone homeostasis.


Conflict of interest statement

The authors declare no competing financial interests.

Figures

Fig. 1
Fig. 1
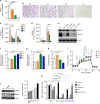
SCFA improve systemic bone mass under steady-state conditions. WT mice not treated (NT) or treated with C2 (acetate), C3 (propionate), or C4 (butyrate) in the drinking water for 8 weeks were analyzed by µCT for a bone volume per total volume (BV/TV) and b trabecular separation (Tb.Sp.). c Representative µCT images of the trabecular part of tibial bone of mice not treated (NT) or treated with SCFA (C2/C3/C4). d Serum CTX-I levels as marker for bone resorption measured by ELISA. e Immunohistological analysis of TRAP-stained osteoclasts in the tibia of SCFA-exposed WT mice showing the number of osteoclasts per analyzed bone parameter (N.Oc./B.pm). f Immunohistological analysis of osteoblasts in the tibia of SCFA-exposed WT mice showing N.Ob./B.pm. g Serum osteocalcin (OCN) bone formation marker measured by ELISA. h-i. RAG1−/ mice NT or treated with C2/C3/C4 in the drinking water for 8 weeks were analyzed by µCT for h BV/TV and i Tb.Sp. j. Immunohistological analysis of TRAP-stained osteoclasts in the tibia of SCFA-exposed RAG1−/ mice showing N.Oc./B.pm. k Serum Crosslaps bone resorption marker measured by ELISA before and after 2 weeks of sodium propionate treatment in healthy control human subjects. l Gas-chromatographic mass-spectrometric analysis of SCFA concentrations in cecal samples expressed as mM per gram feces. m, n WT mice fed with special high-fiber diet (HFD) and normal control diet (ND) analyzed by µCT for m BV/TV and n Tb.Sp. o Immunohistological analysis of TRAP-stained osteoclasts in the tibia of WT mice fed with special HFD and ND showing N.Oc./B.pm. pr WT mice receiving adoptive transfer of isolated Prevotella strains analyzed by p gas-chromatographic mass-spectrometric analysis for SCFA concentration in cecal samples expressed as mM per gram feces and q by µCT for BV/TV. r Representative µCT images of the trabecular part of tibial bone of NT mice or receiving adaptive transfer of isolated Prevotella (P1/P2/P3). Pictures are representative of at least two independent experiments. Data are expressed as the mean ± s.d. Statistical difference was determined by one-way ANOVA or Student's t-test. *p < 0.5; **p < 0.01; ***p < 0.001
Fig. 2
Fig. 2
SCFA suppress osteoclastogenesis by changing cellular metabolism. a Quantification and b representative microphotographs of multinucleated TRAP-positive osteoclasts from in vitro bone marrow cell cultures stimulated with M-CSF and RANKL and treated with 0.5 mM C2, C3, C4, or left untreated (not treated, NT). Scale bar, 1000 µm. cd Real-time PCR analysis of osteoclast marker genes c TRAF6 and d NFATc1 during osteoclast differentiation after 24 and 48 h of SCFA exposure. e Western blot analysis of TRAF6 and NFATc1 expression after C3 and C4 stimulation for 48 h. f, g Analysis of the extracellular acidification rate (ECAR) by glycolysis measured with a Seahorse real-time metabolic analyzer: f glycolytic capacity and g glycolytic reserve. h Ratio of ECAR to oxygen consumption rate (OCR), the latter resembling mitochondrial activity. i Time course of ECAR values in osteoclasts expose to SCFA. j Representative western blots of total AMPK and phosphorylated AMPK (pAMPK) in osteoclasts not treated (NT) or treated with SCFA (C2/C3/C4) (left panel) and quantification of the pAMPK/AMPK ratio (right panel). k Quantification of multinucleated TRAP-positive osteoclasts from in vitro bone marrow cell cultures stimulated with M-CSF and RANKL and treated with 0.5 mM C3 or 0.25 mM C4 or left untreated (not treated, NT) and incubated with 0.1 mM 2-deoxy-D-glucose (2DG), 2.5 nM oligomycin, 5 nM trichostatin A (TSA), or 10 µM anacardic acid. Pictures are representative of at least three independent experiments. Data are expressed as the mean ± s.d. Statistical difference was determined by one-way or two-way ANOVA. *p < 0.5; **p < 0.01; ***p < 0.001
Fig. 3
Fig. 3
SCFA protect from postmenopausal bone loss. a Representative µCT images of the trabecular part of tibial bone of WT sham operated (Sham) or ovariectomized (OVX) mice fed with C2, C3, or C4 in the drinking water for 8 weeks or left untreated (not treated, NT). b Bone volume per total volume (BV/TV) and c trabecular separation (Tb.Sp.) analyzed by µCT. d Immunohistological analysis of TRAP-stained osteoclasts in the tibia of mice showing the number of osteoclasts per analyzed bone parameter (N.Oc./B.pm). e Serum CTX-I bone resorption and f osteocalcin (OCN) bone formation marker levels measured by ELISA. Data are expressed as the mean ± s.d. Pictures are representative of at two independent experiments. Statistical difference was determined by one-way ANOVA. *p < 0.5; **p < 0.01; ***p < 0.001
Fig. 4
Fig. 4
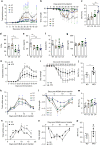
SCFA mitigate arthritis and protect from inflammatory bone loss. aj Collagen-induced arthritis (CIA) model; kp K/BxN serum-induced arthritis (SIA) model. a Joint swelling and b grip strength scores in mice induced for CIA and not treated (NT) or treated with C2 (acetate), C3 (propionate), or C4 (butyrate) in the drinking water. c µCT analysis of tibial bone mass showing bone volume per total volume (BV/TV). d Immunohistological analysis of TRAP-stained osteoclasts in the tibia of mice showing total osteoclast cell numbers per paw. e Serum CTX-I bone resorption marker level measured by ELISA. f Immunohistological analysis showing the number of osteoblasts per analyzed bone parameter in the tibia (N.Ob./B.pm). g Osteocalcin (OCN) bone formation marker level measured by ELISA. h Joint swelling and i grip strength scores in mice induced for CIA and fed with special high-fiber diet (HFD) or normal control diet (ND). j µCT analysis of tibial bone mass showing BV/TV. k Joint swelling and l grip strength scores in mice induced for SIA and not treated (NT) or treated with C2/C3/C4 in the drinking water. m µCT analysis of tibial bone mass showing BV/TV. n Joint swelling and o grip strength scores in SIA mice fed with special HFD or ND. p µCT analysis of tibial bone mass showing BV/TV. Data are expressed as the mean ± s.d. expect for a, b, h, I, k, l, n, and o where mean ± s.e.m. is shown. Pictures are representative of at least two independent experiments. Statistical difference was determined by one-way ANOVA, two-way ANOVA, or Student's t-test. *p < 0.5; **p < 0.01; ***p < 0.001

Similar articles

Cited by

References

    1. Correa-Oliveira R, Fachi JL, Vieira A, Sato FT, Vinolo MA. Regulation of immune cell function by short-chain fatty acids. Clin. Transl. Immunol. 2016;5:e73. doi: 10.1038/cti.2016.17. - DOI - PMC - PubMed
    1. Takayanagi H. Osteoimmunology: shared mechanisms and crosstalk between the immune and bone systems. Nat. Rev. Immunol. 2007;7:292–304. doi: 10.1038/nri2062. - DOI - PubMed
    1. Gao Y, et al. IFN-gamma stimulates osteoclast formation and bone loss in vivo via antigen-driven T cell activation. J. Clin. Invest. 2007;117:122–132. doi: 10.1172/JCI30074. - DOI - PMC - PubMed
    1. Teitelbaum SL. Bone resorption by osteoclasts. Science. 2000;289:1504–1508. doi: 10.1126/science.289.5484.1504. - DOI - PubMed
    1. Edwards CJ. Commensal gut bacteria and the etiopathogenesis of rheumatoid arthritis. J. Rheumatol. 2008;35:1477–14797. - PubMed

Publication types

MeSH terms