

General anesthetics cause mitochondrial dysfunction and reduction of intracellular ATP levels
- PMID: 29298324
- PMCID: PMC5752027
- DOI: 10.1371/journal.pone.0190213
General anesthetics cause mitochondrial dysfunction and reduction of intracellular ATP levels
Abstract
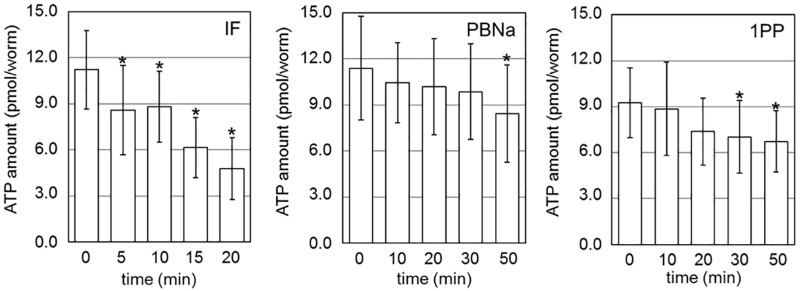
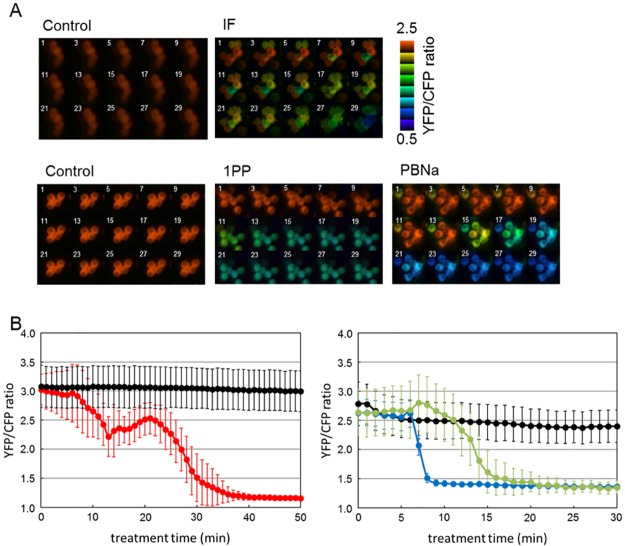
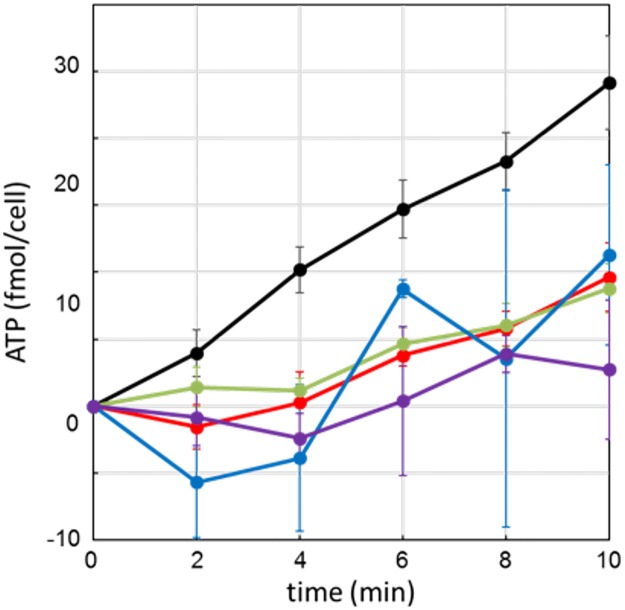
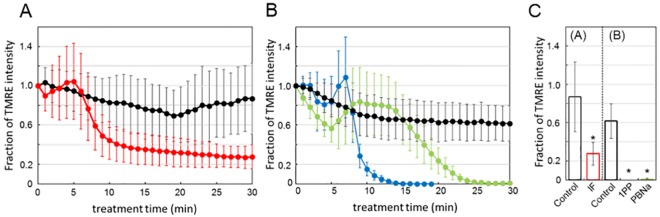
General anesthetics are indispensable for effective clinical care. Although, the mechanism of action of general anesthetics remains controversial, lipid bilayers and proteins have been discussed as their targets. In this study, we focused on the relationship between cellular ATP levels and general anesthetics. The ATP levels of nematodes and cultured mammalian cells were decreased by exposure to three general anesthetics: isoflurane, pentobarbital, and 1-phenoxy-2-propanol. Furthermore, these general anesthetics abolished mitochondrial membrane potential, resulting in the inhibition of mitochondrial ATP synthesis. These results suggest that the observed decrease of cellular ATP level is a common phenomenon of general anesthetics.
Conflict of interest statement
Figures


Similar articles
-
Effects of anesthetics on mitochondrial signaling and function.Curr Drug Saf. 2012 Apr;7(2):126-39. doi: 10.2174/157488612802715681. Curr Drug Saf. 2012. PMID: 22873497 Review.
-
Antioxidant and neuroprotective effects of Dictyophora indusiata polysaccharide in Caenorhabditis elegans.J Ethnopharmacol. 2016 Nov 4;192:413-422. doi: 10.1016/j.jep.2016.09.031. Epub 2016 Sep 17. J Ethnopharmacol. 2016. PMID: 27647012
-
From the Cover: Arsenite Uncouples Mitochondrial Respiration and Induces a Warburg-like Effect in Caenorhabditis elegans.Toxicol Sci. 2016 Aug;152(2):349-62. doi: 10.1093/toxsci/kfw093. Epub 2016 May 20. Toxicol Sci. 2016. PMID: 27208080 Free PMC article.
-
Isoflurane activates human cardiac mitochondrial adenosine triphosphate-sensitive K+ channels reconstituted in lipid bilayers.Anesth Analg. 2007 Oct;105(4):926-32, table of contents. doi: 10.1213/01.ane.0000278640.81206.92. Anesth Analg. 2007. PMID: 17898367
-
Studies on target genes of general anesthetics.Curr Drug Targets. 2002 Feb;3(1):31-41. doi: 10.2174/1389450023348118. Curr Drug Targets. 2002. PMID: 11899263 Review.
Cited by
-
The effect of the PLIN1 gene on the metabolism and mitochondria of porcine skeletal muscle satellite cells.Genes Genomics. 2022 Dec;44(12):1555-1563. doi: 10.1007/s13258-022-01252-x. Epub 2022 Apr 19. Genes Genomics. 2022. PMID: 35438463
-
Network Model With Reduced Metabolic Rate Predicts Spatial Synchrony of Neuronal Activity.Front Comput Neurosci. 2021 Oct 7;15:738362. doi: 10.3389/fncom.2021.738362. eCollection 2021. Front Comput Neurosci. 2021. PMID: 34690730 Free PMC article.
-
ADVERSE REACTION TO ANESTHESIA IN A M.8993T>C CARRIER WITH LEIGH SYNDROMELEIGH SYNDROME: A CASE REPORT WITH A MITOCHONDRIAL DNA MUTATIONAnesthetic considerations in patients with mitochondrial defectsMitochondrial disease and anesthesiaGeneral anesthetics cause mitochondrial dysfunction and reduction of intracellular ATP levels.Rev Paul Pediatr. 2019 Jan-Mar;37(1):135. doi: 10.1590/1984-0462/;2019;37;1;00020. Rev Paul Pediatr. 2019. PMID: 30726454 Free PMC article. No abstract available.
-
Role of ATP-Small Heat Shock Protein Interaction in Human Diseases.Front Mol Biosci. 2022 Feb 16;9:844826. doi: 10.3389/fmolb.2022.844826. eCollection 2022. Front Mol Biosci. 2022. PMID: 35252358 Free PMC article. Review.
-
Methylene Blue Pretreatment Protects Against Repeated Neonatal Isoflurane Exposure-Induced Brain Injury and Memory Loss.Mol Neurobiol. 2024 Aug;61(8):5787-5801. doi: 10.1007/s12035-024-03931-0. Epub 2024 Jan 17. Mol Neurobiol. 2024. PMID: 38233687
References
-
- Campagna JA, Miller KW, Forman SA. Mechanisms of actions of inhaled anesthetics. N Engl J Med. 2003;348: 2110–2124. doi: 10.1056/NEJMra021261 - DOI - PubMed
-
- Weir CJ. The molecular mechanisms of general anaesthesia: dissecting the GABAA receptor. Contin Educ Anaesth Crit Care Pain. 2006;6: 49–53.
-
- Mashour GA, Forman SA, Campagna JA. Mechanisms of general anesthesia: from molecules to mind. Best Pract Res Clin Anaesthesiol. 2005;19; 349–364. - PubMed
-
- Jurd R, Arras M, Lambert S, Drexler B, Siegwart R, Crestani F, et al. General anesthetic actions in vivo strongly attenuated by a point mutation in the GABAA receptor β3 subunit. FASEB J. 2003;17: 250–252. doi: 10.1096/fj.02-0611fje - DOI - PubMed
Publication types
MeSH terms
Substances
Grants and funding
LinkOut - more resources
Full Text Sources
Other Literature Sources
