. 2018 Jan 8;44(1):113-129.e8.
doi: 10.1016/j.devcel.2017.12.003. Epub 2017 Dec 28.

CRISPR Screens Uncover Genes that Regulate Target Cell Sensitivity to the Morphogen Sonic Hedgehog

Affiliations

CRISPR Screens Uncover Genes that Regulate Target Cell Sensitivity to the Morphogen Sonic Hedgehog

Ganesh V Pusapati et al. Dev Cell. .

Erratum in

Abstract

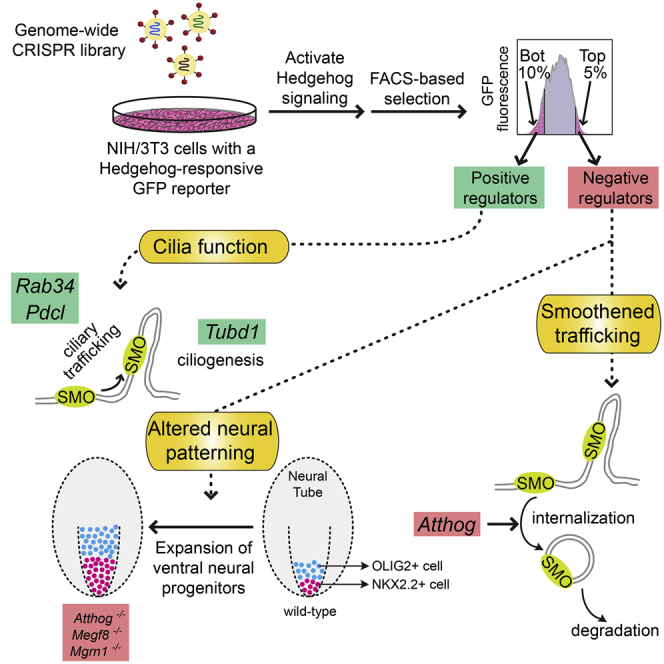
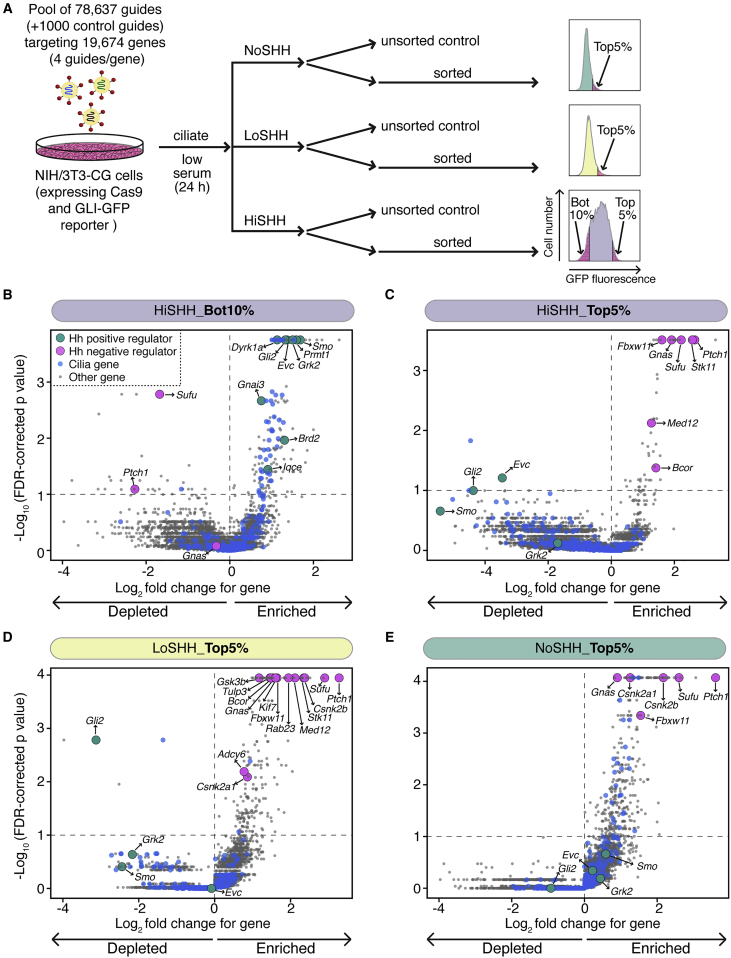
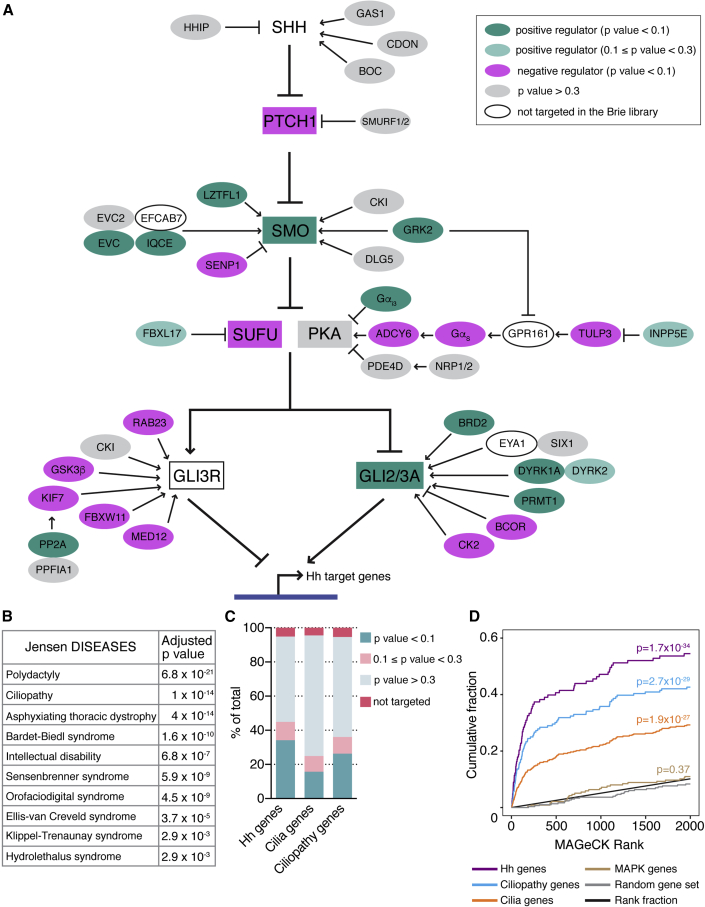
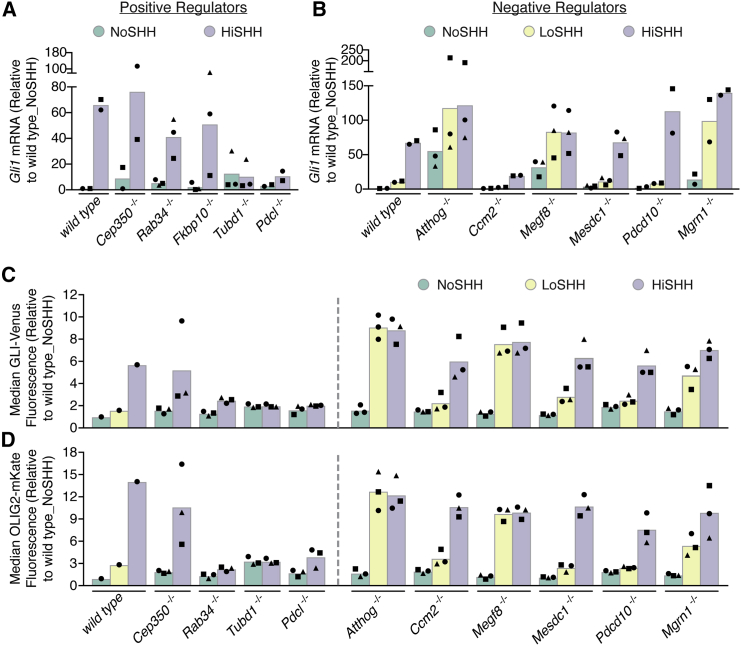
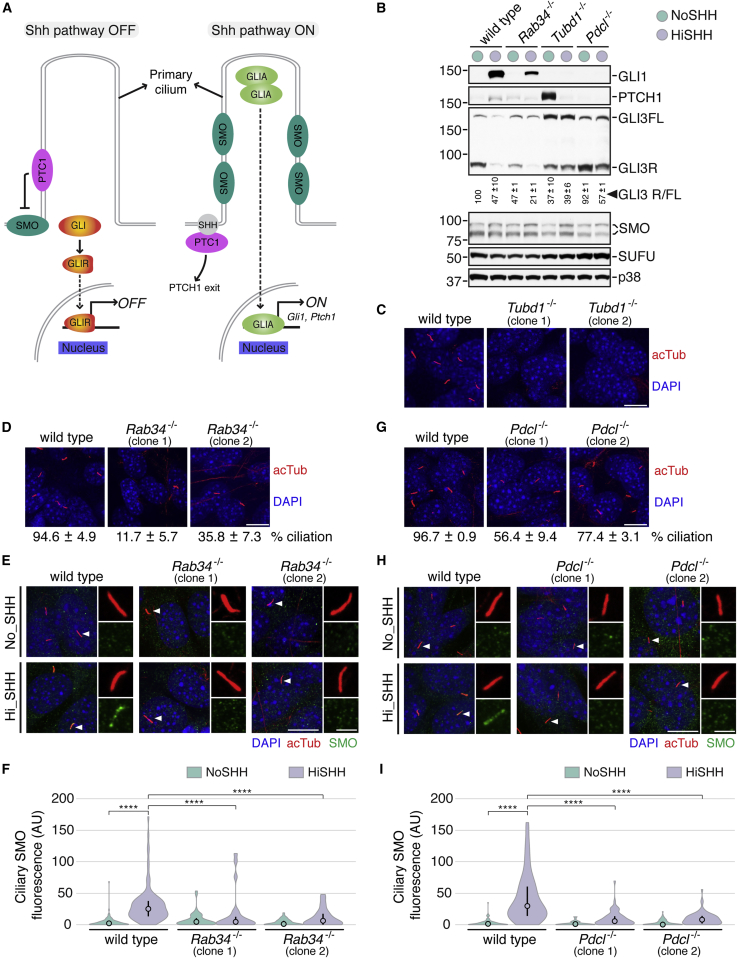
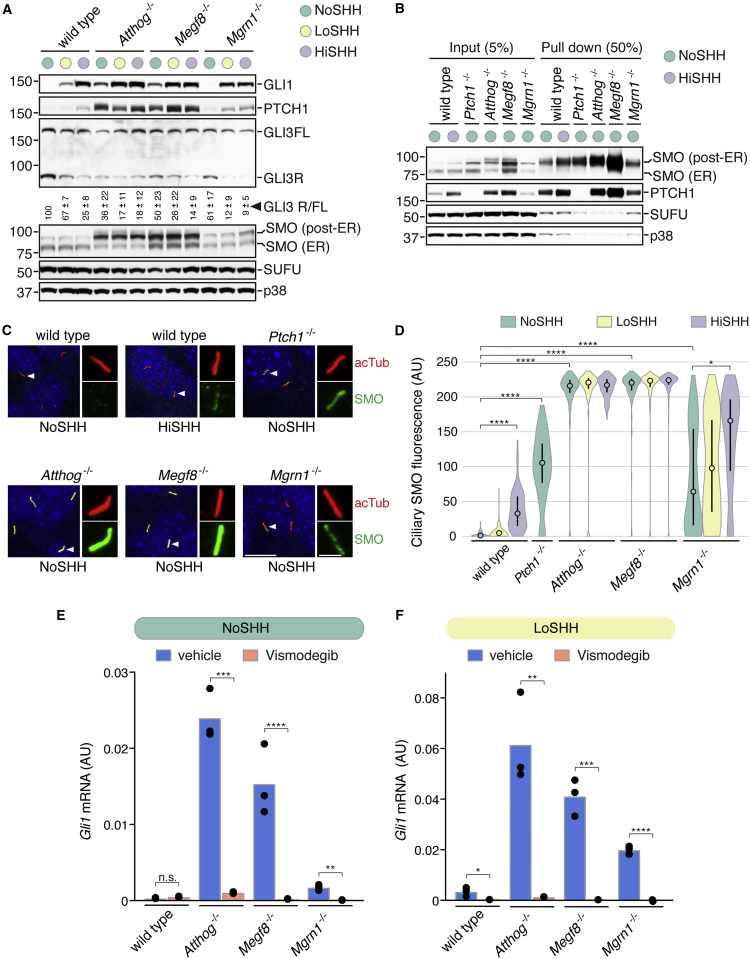
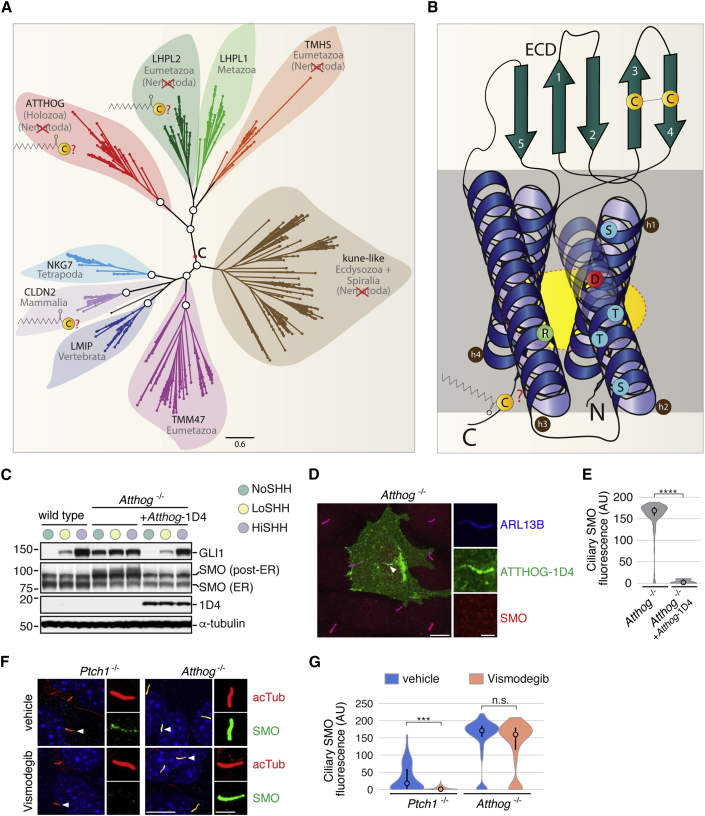
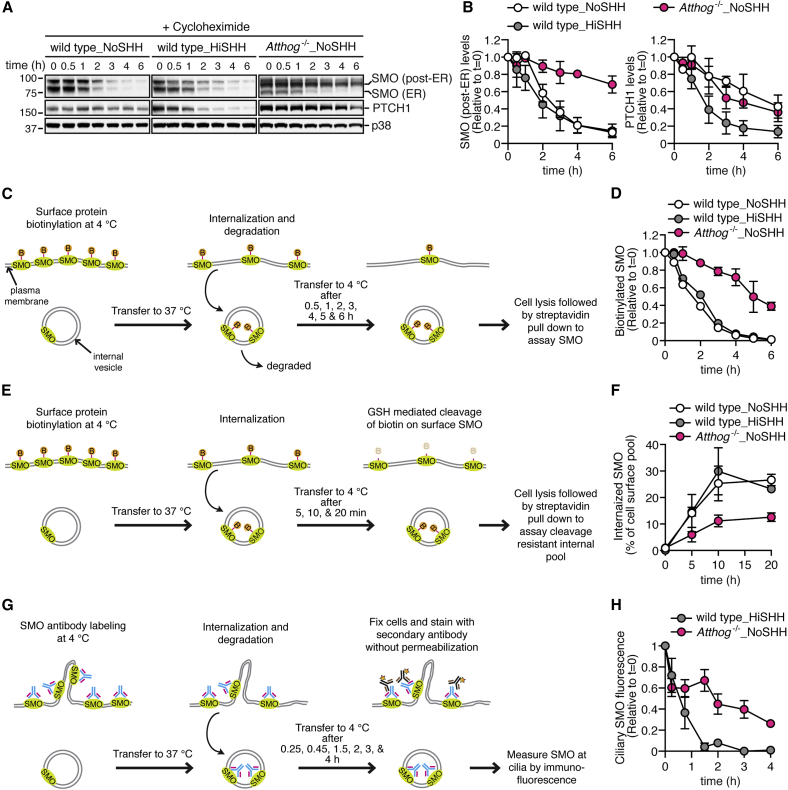
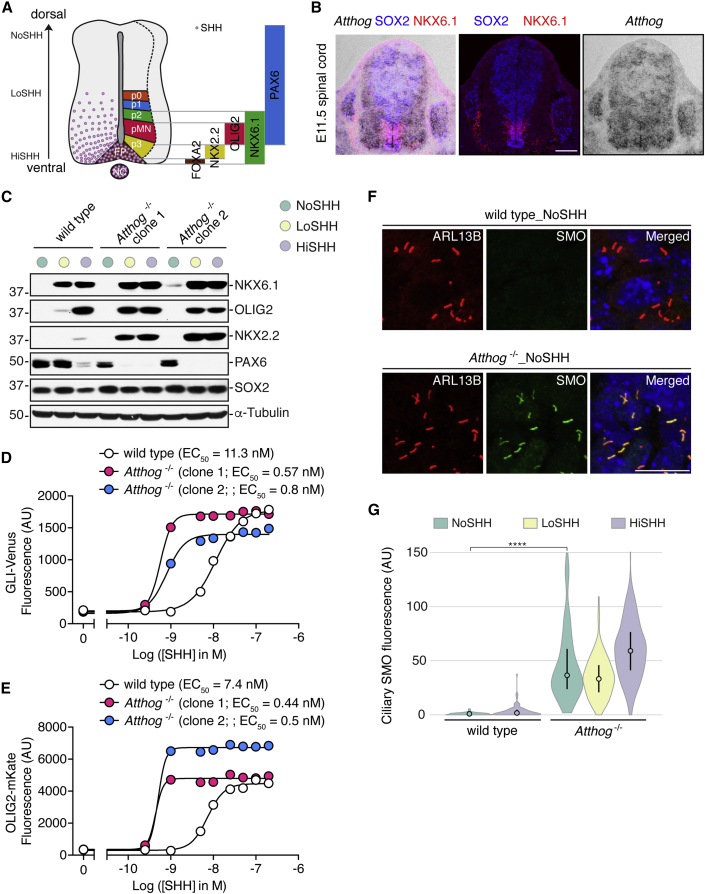
To uncover regulatory mechanisms in Hedgehog (Hh) signaling, we conducted genome-wide screens to identify positive and negative pathway components and validated top hits using multiple signaling and differentiation assays in two different cell types. Most positive regulators identified in our screens, including Rab34, Pdcl, and Tubd1, were involved in ciliary functions, confirming the central role for primary cilia in Hh signaling. Negative regulators identified included Megf8, Mgrn1, and an unannotated gene encoding a tetraspan protein we named Atthog. The function of these negative regulators converged on Smoothened (SMO), an oncoprotein that transduces the Hh signal across the membrane. In the absence of Atthog, SMO was stabilized at the cell surface and concentrated in the ciliary membrane, boosting cell sensitivity to the ligand Sonic Hedgehog (SHH) and consequently altering SHH-guided neural cell-fate decisions. Thus, we uncovered genes that modify the interpretation of morphogen signals by regulating protein-trafficking events in target cells.

Keywords: CRISPR screen; Hedgehog signaling; Smoothened; ciliopathy; congenital heart disease; heterotaxy; morphogen signaling; neural tube patterning; primary cilia; protein trafficking.


Figures

None
Graphical abstract
Figure 1
Figure 1
CRISPR-Based Screens to Identify Genes that Influence Hh Signaling (A) The screening strategy used to identify positive regulators, negative regulators, and attenuators of Hh signaling (see text for details). Bot, bottom. (B–E) Volcano plots from the four screens. For each gene, the x axis shows its enrichment or depletion, calculated as the mean of all four sgRNAs targeting the gene, in the sorted population relative to the corresponding unsorted population, and the y axis shows statistical significance as measured by the false discovery rate (FDR)-corrected p value. The horizontal dashed line represents a p value threshold of 0.1. Positive and negative Hh pathway regulators are labeled as large teal and magenta dots, respectively; cilia genes as medium blue dots; all other genes as small gray dots. See also Figure S1 and Table S1.
Figure 2
Figure 2
Statistically Significant Screen Hits Are Enriched in Known Hh and Cilia Genes (A) Depiction of core (rectangle) and accessory (oval) Hh pathway components, colored according to the FDR-corrected p value for their enrichment in the selected cell populations. (B) Results of enrichment analysis showing the most significant associations between hits from all screens (with an FDR-corrected p value <0.1) in the Jensen database of disease-gene associations (Pletscher-Frankild et al., 2015). (C) Fractional enrichment of known Hh, cilia, and ciliopathy genes in all screens. (D) Cumulative distribution function of HiSHH_Bot10% screen ranks for 123 Hh genes, 407 cilia genes, 176 ciliopathy genes, and two control gene lists (237 MAPK genes from the KEGG database and a random set of 300 genes). Statistical significance was calculated based on the top 2,000 genes using the hypergeometric test. See also Table S2.
Figure 3
Figure 3
Clonal Lines Carrying Deletions in Top Hits Identify Regulators of Hh Signaling (A and B) Hh signaling strength was assessed in clonal, mutant NIH/3T3 cells by measuring Gli1 mRNA by qRT-PCR after LoSHH or HiSHH treatment. (C and D) Hh signaling was assessed in clonal, mutant NPCs exposed to LoSHH or HiSHH using either a fluorescent reporter of target gene induction (GLI-Venus), (C) or a fluorescent reporter of motor neuron differentiation (OLIG2-mKate), (D). Bars represent the mean Gli1 mRNA level (A and B) or mean reporter fluorescence (C and D) from 2 to 3 independent clonal lines. Each data point, derived from a separate clonal cell line, represents either the mean Gli1 mRNA level from two technical replicates (A and B) or the median reporter fluorescence (10,000 cells) from two independent experiments (C and D). See also Figure S2 and Table S3.
Figure 4
Figure 4
Ciliary Integrity Is Impaired in NIH/3T3 Cells Lacking TUBD1, RAB34, and PDCL (A) Ciliary localization of Hh pathway components in the presence and absence of SHH. (B) Immunoblots showing the abundance of Hh pathway proteins and a loading control (p38) in extracts of Rab34−/−, Tubd1−/−, or Pdcl−/− NIH/3T3 cells. Data from an independent set of cell lines are shown in Figure S3E. (C, D, and G) Acetylated tubulin (acTub, red) immunostaining was used to visualize primary cilia and determine the frequency of ciliated cells in wild-type NIH/3T3 cells and two independent Tubd1−/− (C), Rab34−/− (D), or Pdcl−/− (G) clonal cell lines. DAPI (blue) marks nuclei. (E and H) HiSHH-induced ciliary SMO (green) in Rab34−/− (E) and Pdcl−/− (H) cells. Arrowheads identify magnified cilia shown to the right of each panel. (F and I) The distribution of SMO fluorescence intensity (n ∼100 cilia/condition) is shown on a violin plot (see STAR Methods). Statistical significance was determined by the Kruskal-Wallis test; ∗∗∗∗p < 0.0001. Scale bars, 10 μm in merged panels and 2 μm in zoomed displays. See also Figure S3.
Figure 5
Figure 5
ATTHOG, MEGF8, and MGRN1 Regulate Smoothened Signaling (A) Immunoblots showing the abundance of Hh pathway proteins in extracts of Atthog−/−, Megf8−/−, and Mgrn1−/− cells. Data from an independent set of cell lines is shown in Figure S5B. (B) Cell-surface biotinylation to assess levels of SMO and PTCH1 at the plasma membrane of indicated NIH/3T3 cell lines. (C and D) Representative micrographs (C) and corresponding violin plots (D, n ∼ 100 cilia/condition) showing levels of endogenous SMO at primary cilia. Arrowheads point to selected cilia used for zoomed displays shown to the right of each panel. Statistical significance was determined by the Kruskal-Wallis test; p < 0.05 and ∗∗∗∗p < 0.0001. Data from an independent set of clonal cell lines are shown in Figure S5C. (E and F) Basal (E) and LoSHH-induced Gli1 mRNA (F) in Atthog−/−, Megf8−/−, and Mgrn1−/− cell lines after treatment with vismodegib. The mean (bars) of three independent replicates (black dots) is shown with significance tested using the unpaired Student’s t test; ∗p < 0.05, ∗∗p < 0.01, ∗∗∗p < 0.001, ∗∗∗∗p < 0.0001, ns, non-significant (p > 0.05). Scale bars represent 10 μm in merged panels and 2 μm in zoomed displays. See also Figures S4–S6.
Figure 6
Figure 6
ATTHOG Is Related to the Claudins and Suppresses SMO Levels at Primary Cilia (A) Phylogenetic relationships of ATTHOG and its relatives within the tetraspan superfamily (see Figure S7A for an alignment). Families forming monophyletic clades are highlighted in distinct colors. The evolutionary provenance of each family is indicated below the gene name, with potential losses in nematodes indicated by a red cross. Families with cysteines predicted to be palmitoylated are marked (filled yellow circles). White circles with black outlines on the nodes denote a support of ≥0.9 using the Shimodaira-Hasegawa test on 1,000 resamples. The position of the computed ancestral sequence for rooting is shown with a red circle. (B) Predicted topology of the four TM helices of ATTHOG. Highlighted features include the disulfide bridge in the extracellular domain (ECD), polar and charged residues in the TM bundle, and a cysteine in the cytoplasmic tail predicted to be palmitoylated. Clustering of hydrophilic residues within the TM bundle is highlighted with a yellow oval. (C) Immunoblotting showing abundances of the indicated proteins in extracts of WT, Atthog−/−, and Atthog−/− cells stably re-expressing ATTHOG-1D4. (D) Ciliary localization of SMO and ATTHOG in Atthog−/− NIH/3T3 cells transiently transfected with Atthog-1D4 (arrowhead). The imaging field shows one Atthog-1D4 transfected cell (green, its cilium identified with an arrowhead and marked by ARL13B) surrounded by untransfected cells. Ciliary SMO (red) is lost only in the Atthog-transfected cell. (E) Violin plots showing the abundance of endogenous SMO at cilia of Atthog−/− (n = 100) and Atthog−/− cells transfected with Atthog-1D4 (n = 10). (F and G) Representative micrographs (F) and corresponding violin plots (G, n = 100 cilia per condition) showing levels of endogenous SMO at primary cilia of Ptch1−/− and Atthog−/− cells left untreated or treated with vismodegib. Arrowheads point to selected cilia used for zoomed displays shown to the right of each panel. Statistical significance was determined by the Mann-Whitney test (E) or the Kruskal-Wallis test (G); ∗∗∗∗p < 0.0001, ∗∗∗p < 0.001, ns, non-significant (p > 0.05). Scale bars denote 10 μm in merged panels and 2 μm in zoomed displays.
Figure 7
Figure 7
ATTHOG Promotes the Internalization and Degradation of SMO at the Cell Surface (A and B) After blocking new protein synthesis with cycloheximide, immunoblotting was used to measure the abundances of SMO, PTCH1, and p38 (a control) in WT and Atthog−/− cells. Levels of post-ER SMO and PTCH1 at various times after cycloheximide addition were plotted relative to their initial level (set to 1) in (B). (C and D) Experimental scheme used to monitor the degradation of cell-surface SMO. The fraction of biotinylated SMO remaining at various times after cell-surface labeling is plotted in (D) and shown in Figure S7F. (E and F) After labeling cell-surface SMO with a thiol-cleavable biotinylation reagent, internalization was monitored by measuring the amount of biotinylated SMO protected from the cell-impermeable reducing agent glutathione (GSH). (G and H) After labeling live cells with a primary antibody against the extracellular domain of SMO, its levels at cilia were measured at various times after labeling by staining fixed, non-permeabilized cells with a cognate secondary antibody. The fraction of SMO remaining at primary cilia at various times after labeling is shown in (H). Each data point represents a mean ± SD derived from two independent experiments.
Figure 8
Figure 8
ATTHOG Attenuates SHH-Induced Neural Differentiation Programs (A) Progenitor domains within the embryonic spinal cord. NC, notochord; FP, floor plate; pMN, motor neuron progenitors; p0, p1, p2, and p3, ventral interneuron progenitors. A SHH gradient (purple circles) along the ventral to dorsal axis establishes progenitor domains that are each defined by the expression of a set of transcription factors (shown on the right). (B) Distribution of Atthog mRNA (by in situ hybridization) in a transverse section of E11.5 mouse spinal cord tissue relative to the distribution (by IF) of the Hh-responsive transcription factor NKX6.1 (see A) and the neural progenitor marker SOX2. (C) Immunoblots to assess the abundance of transcription factors that define progenitor identity after treatment of NPCs with LoSHH or HiSHH. Induction of NKX6.1, OLIG2, and NKX2.2 requires progressively higher doses of SHH, consistent with their expression at increasingly ventral positions in the neural tube; see (A). (D and E) Activation of the GLI-Venus (D) or OLIG2-mKate (E) reporter in wild-type NPCs and two independent clonal Atthog−/− NPC lines treated with increasing concentrations of SHH. Each point represents the median fluorescence from ∼10,000 cells. A representative dose curve from three independent experiments is shown. (F and G) Representative micrographs (F) and corresponding violin plots (G, n ∼ 100 cilia per condition) showing levels of endogenous SMO at cilia of WT and Atthog−/− NPCs. Scale bars, 100 μm in (B) or 10 μm in (F). Significance was determined by the Kruskal-Wallis test; ∗∗∗∗p < 0.0001.

Similar articles

Cited by

References

    1. Altschul S.F., Madden T.L., Schäffer A.A., Zhang J., Zhang Z., Miller W., Lipman D.J. Gapped BLAST and PSI-BLAST: a new generation of protein database search programs. Nucleic Acids Res. 1997;25:3389–3402. - PMC - PubMed
    1. Bangs F., Anderson K.V. Primary cilia and mammalian hedgehog signaling. Cold Spring Harb Perspect. Biol. 2016;9:a028175. - PMC - PubMed
    1. Bishop B., Aricescu A.R., Harlos K., O'Callaghan C.A., Jones E.Y., Siebold C. Structural insights into hedgehog ligand sequestration by the human hedgehog-interacting protein HHIP. Nat. Struct. Mol. Biol. 2009;16:698–703. - PMC - PubMed
    1. Briscoe J., Thérond P.P. The mechanisms of Hedgehog signalling and its roles in development and disease. Nat. Rev. Mol. Cell Biol. 2013;14:416–429. - PubMed
    1. Cohen M., Briscoe J., Blassberg R. Morphogen interpretation: the transcriptional logic of neural tube patterning. Curr. Opin. Genet. Dev. 2013;23:423–428. - PubMed

Publication types