. 2018 Jan 11;553(7687):233-237.
doi: 10.1038/nature25182. Epub 2017 Dec 20.

Opening of the human epithelial calcium channel TRPV6

Affiliations

Opening of the human epithelial calcium channel TRPV6

Luke L McGoldrick et al. Nature. .

Abstract

Calcium-selective transient receptor potential vanilloid subfamily member 6 (TRPV6) channels play a critical role in calcium uptake in epithelial tissues. Altered TRPV6 expression is associated with a variety of human diseases, including cancers. TRPV6 channels are constitutively active and their open probability depends on the lipidic composition of the membrane in which they reside; it increases substantially in the presence of phosphatidylinositol 4,5-bisphosphate. Crystal structures of detergent-solubilized rat TRPV6 in the closed state have previously been solved. Corroborating electrophysiological results, these structures demonstrated that the Ca2+ selectivity of TRPV6 arises from a ring of aspartate side chains in the selectivity filter that binds Ca2+ tightly. However, how TRPV6 channels open and close their pores for ion permeation has remained unclear. Here we present cryo-electron microscopy structures of human TRPV6 in the open and closed states. The channel selectivity filter adopts similar conformations in both states, consistent with its explicit role in ion permeation. The iris-like channel opening is accompanied by an α-to-π-helical transition in the pore-lining transmembrane helix S6 at an alanine hinge just below the selectivity filter. As a result of this transition, the S6 helices bend and rotate, exposing different residues to the ion channel pore in the open and closed states. This gating mechanism, which defines the constitutive activity of TRPV6, is, to our knowledge, unique among tetrameric ion channels and provides structural insights for understanding their diverse roles in physiology and disease.


Conflict of interest statement

The authors declare no competing financial interests. Readers are welcome to comment on the online version of the paper.

Figures

Extended Data Figure 1
Extended Data Figure 1. Functional characterization of wild type and mutant hTRPV6 channels
a–d, Whole-cell patch-clamp recordings from HEK 293 cells expressing (a) wild type hTRPV6, (b) hTRPV6-R470E, (c) hTRPV6-Q483A and (d) hTRPV6-A566T. Shown are leak-subtracted currents in response to voltage ramp protocols illustrated above the recordings. Although the shape of the currents for wild type and mutant hTRPV6 channels was similar, their amplitudes were different. The average current amplitudes at −60 mV membrane potential (mean ± SEM) were 3171 ± 767 pA (n = 11) for wild type hTRPV6, 918 ± 267 pA (n = 9) for hTRPV6-R470E, 2239 ± 398 pA (n = 7) for hTRPV6-Q483A and 145 ± 52 pA (n = 5) for hTRPV6-A566T. e–h, Kinetics of calcium uptake using Fura-2 AM ratiometric fluorescence measurements. Shown are representative fluorescence curves for (e) wild type hTRPV6, (f) hTRPV6-R470E, (g) hTRPV6-Q483A and (h) hTRPV6-A566T in response to application of 2 mM Ca2+ (arrow). Exponential fits are shown in red, with the time constants indicated. Over five measurements, the time constants (mean ± SEM) were 4.2 ± 0.5 s for hTRPV6, 47 ± 13 s for hTRPV6-R470E, 18.9 ± 0.8 s for hTRPV6-Q483A and 121 ± 12 s for hTRPV6-A566T. At n = 5 and P = 0.05, the time constant values for wild type and mutant channels were statistically different (two-sided t-test). i–j, Fluorescence curves for (i) wild type hTRPV6 and (j) hTRPV6-R470E in response to application of 2 mM Ca2+ after pre-incubation of cells in different concentrations of 2-APB. These experiments were repeated independently three times with similar results. k, Dose-response curves for 2-APB inhibition calculated for wild type hTRPV6 (black) and hTRPV6-R470E (red) (n = 3 for all measurements). The changes in the fluorescence intensity ratio at 340 and 380 nm (F340/F380) evoked by addition of 2 mM Ca2+ after pre-incubation with various concentrations of 2-APB were normalized to the maximal change in F340/F380 after addition of 2 mM Ca2+ in the absence of 2-APB. Straight lines through the data points are fits with the logistic equation, with the mean ± SEM values of half-maximum inhibitory concentration (IC50), 274 ± 27 μM and 85 ± 5 μM, and the maximal inhibition, 72.6 ± 2.7 % and 50.3 ± 1.1 %, for hTRPV6 and hTRPV6-R470E, respectively. The leftward shift of the 2-APB dose-response curve of hTRPV6-R470E, when compared to the dose-response curve of wild type hTRPV6, indicates an increased affinity of the channel for 2-APB. This is likely the result of the R470E mutation reducing the affinity of the channel for an activating lipid ligand. On the other hand, the reduced maximum inhibition of hTRPV6-R470E at high concentrations of 2-APB, when compared to that of wild type hTRPV6, indicates a reduced efficacy of 2-APB that could be a result of the R470E mutation disrupting the mechanism by which 2-APB binding is allosterically coupled to channel gating.
Extended Data Figure 2
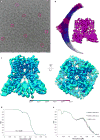
Extended Data Figure 2. Overview of single-particle cryo-EM for hTRPV6 in nanodiscs
a, Example cryo-EM micrograph for hTRPV6 in nanodiscs. b, Orientations of particles that contribute to the final 3.6 Å reconstruction. Longer red rods represent orientations that comprise more particles. c, Local resolution mapped on density at 0.013 threshold level (UCSF Chimera) calculated using Resmap and two unfiltered half maps, with the highest resolution observed for the channel core. d, FSC curve calculated between half-maps. e, Cross-validation FSC curves for the refined model versus unfiltered half maps (only half map1 was used for PHENIX refinement) and the unfiltered summed map.
Extended Data Figure 3
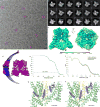
Extended Data Figure 3. Overview of single-particle cryo-EM for hTRPV6 in amphipols and comparison to the reconstruction in nanodiscs
a, Example cryo-EM micrograph for hTRPV6 in amphipols. b, Reference-free two-dimensional class averages of hTRPV6 in amphipols illustrating different particle orientations. c, Local resolution mapped on density at 0.01 threshold level (UCSF Chimera) calculated using Resmap and two unfiltered half-maps, with the highest resolution observed for the channel core. d, Orientations of particles that contribute to the final 4.0 Å reconstruction. Longer red rods represent orientations that comprise more particles. e, FSC curve calculated between half-maps. f, Cross-validation FSC curves for the refined model versus unfiltered half maps (only half map1 was used for PHENIX refinement) and the unfiltered summed map. g–h, Comparison of putative lipid densities for hTRPV6 in (g) amphipols and (h) nanodiscs, filtered to the same (4.0 Å) resolution and shown at 3.5σ as purple mesh.
Extended Data Figure 4
Extended Data Figure 4. Cryo-EM density for hTRPV6 in nanodiscs
a, Cryo-EM density at 4σ for a single hTRPV6 subunit, with the protein shown in ribbon and colored according to domains. b–g, Fragments of the hTRPV6 transmembrane domain with the corresponding cryo-EM density.
Extended Data Figure 5
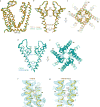
Extended Data Figure 5. Fitting lipids into cryo-EM density
a–c, Molecules of (a) phosphatidylethanolamine (PE), (b) phosphatidylcholine (PC) and (c) phosphatidylinositol 4,5-bis phosphate (PIP2) fitted into the site 4 lipid density shown at 3.5σ as purple mesh. d–f, Molecules of (d) cholesterol, (e) cholesterol hemisuccinate (CHS) and (f) PIP2 fitted into the site 2 putative activating lipid density shown at 5.3σ.
Extended Data Figure 6
Extended Data Figure 6. Overview of single-particle cryo-EM for hTRPV6-R470E in amphipols
a, Example cryo-EM micrograph for hTRPV6-R470E in amphipols. b, Reference-free two-dimensional class averages of hTRPV6-R470E in amphipols illustrating different particle orientations. c, Local resolution mapped on density at 0.017 threshold level (UCSF Chimera) calculated using Resmap and two unfiltered half-maps, with the highest resolution observed for the channel core. d, Orientations of particles that contribute to the final 4.2 Å reconstruction. Longer red rods represent orientations that comprise more particles. e, FSC curve calculated between half-maps. f, Cross-validation FSC curves for the refined model versus unfiltered half maps (only half map1 was used for PHENIX refinement) and the unfiltered summed map.
Extended Data Figure 7
Extended Data Figure 7. Overview of single-particle cryo-EM for rTRPV6 in CNW11 nanodiscs
a, Example cryo-EM micrograph for rTRPV6 in CNW11 nanodiscs. b, Reference-free two-dimensional class averages of rTRPV6 in CNW11 nanodiscs illustrating different particle orientations. c, Local resolution mapped on density at 0.011 threshold level (UCSF Chimera) calculated using Resmap and two unfiltered half maps, with the highest resolution observed for the channel core. d, Orientations of particles that contribute to the final 3.9 Å reconstruction. Longer red rods represent orientations that comprise more particles. e, FSC curve calculated between half-maps. f, Cross-validation FSC curves for the refined model versus unfiltered half-maps (only half-map1 was used for PHENIX refinement) and the unfiltered summed map.
Extended Data Figure 8
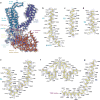
Extended Data Figure 8. Comparison of cryo-EM and crystal structures of rTRPV6, cryo-EM structures of hTRPV6-R470E and rTRPV6 and regions in hTRPV6 and hTRPV6-R470E encompassing D489 and T581
a–c, Superimposed are (a) the transmembrane domain of a single subunit, and (b–c) the pore-forming region viewed (b) parallel to the membrane or (c) intracellularly for the cryo-EM (green) and crystal (orange) structures of rTRPV6. Only two of four rTRPV6 subunits are shown in b, with the front and back subunits omitted for clarity. Residues lining the selectivity filter and gate are shown as sticks. d–e, Superposition of the P-loop and S6 in cryo-EM structures of hTRPV6-R470E (blue) and rTRPV6 (green), viewed (d) parallel to the membrane, and (e) intracellularly. In d, only two of four subunits are shown, with the front and back subunits removed for clarity. The residues lining the pore are shown as sticks. f–g, Regions in (f) hTRPV6 and (g) hTRPV6-R470E encompassing D489 and T581. The closest distance between D489 and T581 is indicated by dashed lines. Note, M485 and M577 either surround the potentially interacting D489 and T581 (f, hTRPV6) or reside between these residues (g, hTRPV6-R470E), apparently preventing their interaction. Blue mesh shows cryo-EM density at 4σ.
Extended Data Figure 9
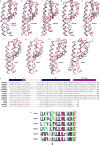
Extended Data Figure 9. Structural superposition and sequence alignment of the pore domain in tetrameric ion channels
a–i, Pairwise superposition of the pore domain in hTRPV6 with (a) rat TRPV1 (PDB ID: 5IRX; RMSD = 2.065 Å), (b) rabbit TRPV2 (PDB ID: 5AN8; RMSD = 3.757 Å), (c) rat TRPV2 (PDB ID: 5HI9; RMSD = 4.399 Å), (d) human TRPA1 (PDB ID: 3J9P; RMSD = 1.429 Å), (e) human PKD2 (PDB ID: 5T4D; RMSD = 2.676 Å), (f) KcsA from Streptomyces lividans (PDB ID: 1BL8; RMSD = 2.708 Å), (g) MthK from M. thermautotrophicum (PDB ID: 1LNQ; RMSD = 2.947 Å), (h) rat Shaker (PDB ID: 2A79; RMSD = 2.487 Å) and (i) rat GluA2 AMPA-subtype iGluR (PDB ID: 5WEO; RMSD = 2.044 Å). j, Sequence alignment for the pore region of human TRPV3–6, TRPA1 and PKD2, rat TRPV1, 2, 6, Shaker and GluA2, rabbit TRPV2 and bacterial K+ channels KcsA and MthK. The selectivity filter residues in K+ channels and gating hinge residues in S6 (M3 in GluA2) are colored red. k, Aligned sequence logos for TRPV channels in S6, generated by WebLogo from 1200 TRPV1–6 sequences. The red rectangle and arrow indicate the position of the alanine gating hinge in TRPV6. Note, the relatively small side chain residues threonine or alanine at the next to the gating hinge alanine position in TRPV5 and TRPV6, instead of bulky hydrophobic phenylalanine or tyrosine in TRPV1–4, might be critical for the α-to-π helical transition in S6 during channel opening.
Figure 1
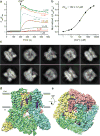
Figure 1. Function and cryo-EM of hTRPV6
a–b, Functional characterization of hTRPV6 using ratiometric fluorescence measurements. a, Fluorescence curves recorded from HEK 293 cells expressing hTRPV6 in response to the application of Ca2+ (arrow) at different concentrations. These experiments were repeated independently three times with similar results. b, Ca2+ dose-response curve for the maximal value of fluorescence fitted with the logistic equation. Calculated IC50 is the mean ± SEM (n = 3). c, Two-dimensional class averages of hTRPV6 particles, showing diverse orientations. d–e, hTRPV6 3.6 Å cryo-EM reconstruction, with density shown at 0.035 threshold level (UCSF Chimera) representing hTRPV6 subunits colored green, cyan, pink and yellow, lipid in purple and ions in red.
Figure 2
Figure 2. Structure of hTRPV6
a–b, Side (a) and top (b) views of hTRPV6 tetramer, with each subunit (A–D) shown in different color. Putative lipid densities at 3.5σ and ion densities at 4σ are illustrated by purple and red mesh, respectively. c, Expanded view of the four (1–4) putative lipid densities per hTRPV6 subunit. d–e, Expanded views of the putative ion densities at 4σ at the (d) selectivity filter and (e) S6 helices bundle crossing.
Figure 3
Figure 3. Open and closed ion channel pore
a–b, Ion conduction pathway (green) in (a) open hTRPV6 and (b) closed hTRPV6-R470E, with residues lining the selectivity filter and around the gate shown as sticks. Only two of four subunits are shown, with the front and back subunits removed for clarity. c, Pore radius calculated using HOLE for hTRPV6 (orange) and hTRPV6-R470E (blue). d–e, Intracellular view of the S6 bundle crossing in (d) hTRPV6 and (e) hTRPV6-R470E. f, Superposition of the selectivity filter regions in hTRPV6 (orange) and hTRPV6-R470E (blue), viewed extracellularly. g, Superposition of the P-loop and S6 in hTRPV6 (orange) and hTRPV6-R470E (blue), viewed parallel to the membrane. The straight line shows the pore axis, red arrow indicates the position of the gating hinge alanine A566 and black arrows illustrate ~100° rotation and ~11° bending away from the pore axis of the C-terminal part of S6.
Figure 4
Figure 4. Activation-related lipid binding pocket
a, Superposition of the agonist binding site in TRPV1 structures in the PI-bound closed state (blue, PDB ID: 5IRZ), antagonist CPZ-bound closed state (pink, PDB ID: 5IS0) and agonist RTX-bound open state (orange, PDB ID: 5IRX). b–d, Putative activating lipid binding site in (b) open hTRPV6, (c) closed hTRPV6-R470E and (d) closed rTRPV6, with densities filtered to the same resolution (4.24 Å) and shown at 5.3σ as purple mesh. Residues involved in gating are shown as sticks. Dashed lines in b indicate bonds between the residues.
Figure 5
Figure 5. TRPV6 channel gating mechanism
Cartoons represent the structural changes associated with TRPV6 channel gating. Transition from the closed to open state, stabilized by the formation of salt bridges (dashed lines), leads to permeation of ions (green spheres) and is accompanied by a local α-to-π helical transition in S6 that maintains the selectivity filter conformation, while the lower part of S6 bends by ~11° and rotates by ~100°. These movements result in a different set of residues (blue versus pink symbols) lining the pore in the vicinity of the channel gate.

Similar articles

Cited by

References

    1. Peng JB, et al. Molecular cloning and characterization of a channel-like transporter mediating intestinal calcium absorption. J Biol Chem. 1999;274:22739–22746. - PubMed
    1. Yue L, Peng JB, Hediger MA, Clapham DE. CaT1 manifests the pore properties of the calcium-release-activated calcium channel. Nature. 2001;410:705–709. - PubMed
    1. Owsianik G, Talavera K, Voets T, Nilius B. Permeation and selectivity of TRP channels. Annu Rev Physiol. 2006;68:685–717. - PubMed
    1. Woudenberg-Vrenken TE, et al. Functional TRPV6 channels are crucial for transepithelial Ca2+ absorption. Am J Physiol Gastrointest Liver Physiol. 2012;303:G879–885. - PubMed
    1. Fecher-Trost C, Weissgerber P, Wissenbach U. TRPV6 channels. Handb Exp Pharmacol. 2014;222:359–384. - PubMed

Publication types