. 2017 Dec 21;552(7685):362-367.
doi: 10.1038/nature24633. Epub 2017 Dec 13.

Origin and differentiation of human memory CD8 T cells after vaccination

Affiliations

Origin and differentiation of human memory CD8 T cells after vaccination

Rama S Akondy et al. Nature. .

Abstract

The differentiation of human memory CD8 T cells is not well understood. Here we address this issue using the live yellow fever virus (YFV) vaccine, which induces long-term immunity in humans. We used in vivo deuterium labelling to mark CD8 T cells that proliferated in response to the virus and then assessed cellular turnover and longevity by quantifying deuterium dilution kinetics in YFV-specific CD8 T cells using mass spectrometry. This longitudinal analysis showed that the memory pool originates from CD8 T cells that divided extensively during the first two weeks after infection and is maintained by quiescent cells that divide less than once every year (doubling time of over 450 days). Although these long-lived YFV-specific memory CD8 T cells did not express effector molecules, their epigenetic landscape resembled that of effector CD8 T cells. This open chromatin profile at effector genes was maintained in memory CD8 T cells isolated even a decade after vaccination, indicating that these cells retain an epigenetic fingerprint of their effector history and remain poised to respond rapidly upon re-exposure to the pathogen.


Conflict of interest statement

The authors declare no competing financial interests.

Figures

Extended Data Figure 1
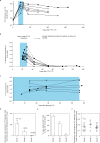
Extended Data Figure 1. The dynamics of deuterium enrichment in body water
Deuterium enrichment in body water for each vaccinee in study 1 (n = 10). Plasma or saliva was used to sample body water.
Extended Data Figure 2
Extended Data Figure 2. Investigating the in vivo kinetics of YFV-specific CD8 T cells using heavy water labelling at a range of stages of the immune response to YFV-17D
a, Kinetics of the CD8 T cell response tracked by MHC class-I tetramer staining for vaccinees in study 2. b, c, Graphs show dynamics of the deuterium enrichment in body water for each vaccinee in study 2 (b, n = 8) and study 3 (c, n = 8). The period of water intake is indicated by the shaded blue area. d. The cell division rate constant (mean and s.d.) of A2-NS4B214 tetramer+ CD8 T cells. This represents the rate per day of newly divided A2-NS4B214 tetramer+ CD8 T cells during the D2O labelling period. Deuterium incorporation at the end of the water intake period in each study was used for this calculation. e. The percentage of deuterium-labelled A2-NS4B214 tetramer+ CD8 T cells (mean and s.d.) at the end of the water intake period in each study. f, The cell division rate constants of YFV-specific memory CD8 T cells during the maintenance period (same data as in Fig. 2f). Each circle represents data from one donor; horizontal lines show mean and s.e.m. The division rate constants were calculated by dilution kinetics of deuterium enrichment (studies 1 and 2) or by incorporation kinetics of deuterium uptake (study 3).
Extended Data Figure 3
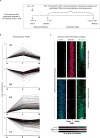
Extended Data Figure 3. Transcriptional and epigenetic changes during effector and memory differentiation of YFV-specific CD8 T cells
a, Schematic of time points used for transcriptional or epigenetic analysis of tetramer-sorted YFV-specific CD8 T cells. b, Gene expression (by microarray analysis) was normalized to fold change over naive samples, and unsupervised k-means clustering was performed. Four major expression patterns emerged: genes that were up- or downregulated during the effector phase and then reverted to the naive state, and genes that were up- or downregulated during the effector stage and persisted into the memory phase. Red lines show the mean expression and numbers on the graph indicate the number of transcripts within each cluster. Data represent mean of four donors for tetramer+ effector CD8 T cells and six donors for tetramer+ memory CD8 T cells. c, MeDIP–seq analysis of genome-wide DNA methylation in bulk naive and tetramer-sorted effector and memory CD8 T cell subsets. The figure shows the top 4,000 regions that were differentially methylated (2,000 methylated and 2,000 demethylated regions) in the YFV-specific effector CD8 T cells relative to the naive CD8 T cells. Each band represents a 1,000-bp region surrounding a differentially methylated region. Regions methylated in naive CD8 T cells (blue), YFV-specific effector CD8 T cells (red) and YFV-specific memory CD8 T cells (green) are shown. Each sample was obtained from a single donor.
Extended Data Figure 4
Extended Data Figure 4. Pathways enriched in YFV-specific effector and memory CD8 T cells
Genes from the transient or maintained clusters identified from the microarray analysis in Extended Data Fig. 3 were analysed using MSigDB to identify Reactome pathways and transcription factors associated with each expression pattern. Figures show the topmost ten significant pathways (a) and transcription factors (b) associated with each expression pattern and the corresponding negative logarithm of the P values.
Extended Data Figure 5
Extended Data Figure 5. Naive and YFV memory CD8 T cell responses to homeostatic cytokines
Proliferation of naive CD8 T cells (upper panels) or YFV-specific long-term (>8 years) memory CD8 T cells (lower panels) after stimulation in vitro with different doses of IL-7 or IL-15 (n = 3). Histogram plots are gated on naive CD8 T cells or tetramer+ CD8 T cells.
Extended Data Figure 6
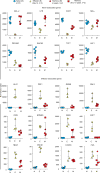
Extended Data Figure 6. RNA-seq analysis of YFV tetramer-sorted effector and long-term memory CD8 T cells
Scatter graphs show the expression of selected genes plotted as normalized reads (mean ± s.d.) from RNA-seq analysis of naive, YFV-effector (day 14) and YFV-memory (4–13 years) CD8 T cells.
Extended Data Figure 7
Extended Data Figure 7. Comparing human YFV-specific effector and memory CD8 T cell signatures with mouse effector and memory CD8 T cells
The RNA-seq data from YFV-tetramer+ effector and long-term memory CD8 T cells was compared with published mouse transcriptional profiles. The datasets used were from Kaech et al., 2002 (1); Doering et al., 2012 (2); Wherry et al., 2007 (3); Wirth et al., 2010 (4); and Sarkar et al., 2008 (5). a, Enrichment plots show the proportion of genes in the leading edge; the colour of the plots shows the normalized enrichment score. The size of the circles represents the number of genes in the mouse signatures that are present in the leading edge of the enrichment plots. b, The GSEA leading edge analysis tool was used to identify genes that were commonly correlated to the effector or memory phenotype and that overlapped with genes in the corresponding mouse signatures.
Extended Data Figure 8
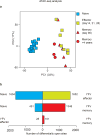
Extended Data Figure 8. Analysis of open chromatin sites in YFV-specific effector and memory CD8 T cells using ATAC–seq
ATAC–seq analysis was performed using naive CD8 T cells (n = 15) and YFV-tetramer+ effector (n = 8), early memory (n = 5) and long-lived memory CD8 T cells (n = 3). a, Principal component analysis of ATAC–seq data showing principal component 1 (PC1) versus 2 (PC2). Each circle represents a sample from one donor. b, Comparison of the number of open chromatin peaks that are significantly different between CD8 T cell subsets. Bars to the left, number of open sites in the subset listed to the left; bars to the right, number of open sites in the CD8 T cell subset that was used for comparison. The day 90 YFV-memory (n = 5) and >4 year YFV-memory (n = 3) samples were all placed in the memory group for this comparison.
Extended Data Figure 9
Extended Data Figure 9. Open chromatin sites near the TSSs of BCL-2 and IL-7R (CD127) in YFV-specific effector and memory CD8 T cells
Plots show traces of chromatin openness (y axis) at the IL-7R and BCL-2 loci (x axis). The dashed rectangles represent the ATAC–seq peaks identified as open that were significantly different between at least two subpopulations. The RefSeq gene tracks are represented in the bottom row. We identified open sites at the TSS as well as immediately upstream and downstream of the TSS for IL7R in naive cells that all transiently lost accessibility in effector CD8 T cells and then opened in the YFV-specific memory CD8 T cells. A similar temporary pattern was seen for open chromatin regions in the BCL2 gene. We found an accessible site downstream of the BCL2 TSS that partially closes in effector cells but then regains openness to an even greater extent in memory cells than in naive cells, consistent with previous observations that memory cells are characterized by increased BCL-2 expression.
Extended Data Figure 10
Extended Data Figure 10. Phenotypic comparison between YFV-specific long-term memory CD8 T cells and bulk stem-like memory (TSCM) CD8 T cell population
Samples were obtained from individuals vaccinated with YFV-17D more than 8 years previously and CD8 T cells enriched by negative selection were used to compare bulk naive and bulk TSCM CD8 T cells with A2-NS4B214 tetramer+ CD8 T cells in the same stain. a, The gating schemes for naive, TSCM and A2-NS4B214 tetramer+ CD8 T cells. b, Histogram plots show the expression of CD58 (LFA-3) and CD122 (IL-2Rβ) on gated naive (filled grey histogram), TSCM (blue) and A2-NS4B214 tetramer+ CD8 T cells (red). Data are representative of three experiments.
Figure 1
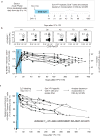
Figure 1. Measuring the turnover rate and half-life of human YFV-specific CD8 T cells using in vivo deuterium labelling
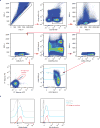
a, Design for study 1. b, FACS plots show percentage of tetramer+ CD8 T cells in a representative vaccinee. Graph shows the longitudinal analysis of YFV-specific tetramer+ CD8 T cells in the blood after vaccination (solid lines, n = 12). The period of D2O intake is shown as a shaded blue area; the kinetics of YFV-17D genomes in the plasma from a separate group of vaccinees is shown as a dashed line. APC, allophycocyanin, PerCP, peridinin chlorophyll. c, Dilution curves of the deuterium enrichment in A2-NS4B214 tetramer+ CD8 T cells sorted at various times post-vaccination, in study 1 (n = 10). The average T1/2 of label enrichment was calculated after wash-out of deuterium from body water (day 42 onwards). Data for each vaccinee are shown as a percentage of the label incorporation seen at the end of the heavy water intake period.
Figure 2
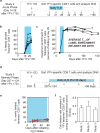
Figure 2. Heavy water labelling during different stages of the immune response to investigate the in vivo kinetics of YFV-specific CD8 T cells
a, Design for study 2. b, The percentage of YFV-tetramer+ cells that incorporated deuterium during the D2O intake period (shaded blue area). c, Die-away curves of deuterium enrichment after label washout. Data are normalized to maximum label incorporation, seen at day 28 (n = 7). d, Design for study 3. e, The percentage of newly divided A2-NS4B214 tetramer+ CD8 T cells that incorporated deuterium during the D2O intake period (shaded blue area) for study 3 (n = 8). f, The cell division rate constants of YFV-specific memory CD8 T cells, calculated either by die-away kinetics of deuterium enrichment (reflecting dilution rates of labelled cells by unlabelled cells; studies 1 and 2) or by kinetics of deuterium uptake (reflecting division rates of labelled cells; study 3). The corresponding T1/2 of the deuterium enrichment (and hence the division rate of tetramer+ memory CD8 T cells) is 493 days (study 1), 460 days (study 2) or 476 days (study 3). Bar graphs show mean and s.e.m.
Figure 3
Figure 3. Phenotypic, functional and transcriptional profiling of long-lived YFV-specific memory CD8 T cells
a, Phenotype of A2-NS4B214 tetramer+ CD8 T cells in individuals vaccinated 8–12 years previously (n = 6–9). b, Expression of markers that distinguish A2-NS4B214 tetramer+ memory CD8 T cells of individuals vaccinated over a decade previously (red) from naive CD8 T cells (black), n = 7. c. Expression of proliferation marker Ki-67 in naive (black), YFV-tetramer+ day 14 (green) and YFV-tetramer+ long-term memory CD8 T cells (red, n = 3). d, e, Proliferation of YFV-specific long-term (>8 years) memory CD8 T cells in vitro after stimulation with NS4B214 peptide (d, n = 3) or homeostatic cytokines (e, n = 3). Histogram plots are gated on tetramer+ CD8 T cells. f, Experimental setup for isolation and characterization of naive YFV-tetramer+ CD8 T cells from unvaccinated individuals. g, Phenotypic analysis of A2-NS4B214 naive tetramer+ CD8 T cells from unvaccinated individuals (blue, n = 3) and total naive CD8 T cells (black, n = 3). h, IFNγ production (mean ± s.e.m.) by tetramer-enriched CD8 T cells from unvaccinated individuals (n = 3) or from individuals vaccinated more than 8 years previously (n = 3). The dashed line shows the limit of detection. In the absence of peptide controls, no spots were detected in the cells from either unvaccinated or vaccinated individuals. i, Principal component analysis of RNA-seq data from naive and YFV-tetramer+ effector and memory CD8 T cells. Each data point represents one sample. j, Pathway analysis of RNA-seq data comparing YFV-specific long-term memory CD8 T cells and naive CD8 T cells. Circle size represents the number of genes in the gene set and length of connecting lines is proportional to how many genes overlap.
Figure 4
Figure 4. Long-lived YFV-specific memory CD8 T cells retain the epigenetic marks of their effector history
a, c, Expression of granzyme B (a) and perforin (c) in naive and A2-NS4B214 effector, early memory and long-term memory CD8 T cells. PE, phycoerytherin; FITC, fluorescein isothiocyanate. b, d, Locus-specific bisulfite sequencing analysis of the CpG regions proximal to the promoter of GZMB (b) or PRF1 (d) in DNA from naive or tetramer+ CD8 T cells. Filled circles, methylated cytosine; open circles, non-methylated cytosine. e, ATAC–seq analysis of open chromatin in naive CD8 T cells (n = 15) and YFV-tetramer+ effector (n = 8), early memory (n = 5) and long-lived memory CD8 T cells (n = 3). Principal component analysis of ATAC–seq data summarizing the median, 25th and 75th percentiles for principal component 1. Each circle represents a sample from one donor. f, Traces of chromatin openness (y axis) near the IFNG and GZMB loci (x axis). The dashed rectangles represent open peaks that were significantly different (Wald test < 0.05) between at least two subpopulations. The purple line indicates the location of the CpGs investigated (in b) for methylation near the GZMB locus.

Comment in

Similar articles

Cited by

References

    1. Ahmed R, Gray D. Immunological memory and protective immunity: understanding their relation. Science. 1996;272:54–60. - PubMed
    1. Lau LL, Jamieson BD, Somasundaram T, Ahmed R. Cytotoxic T-cell memory without antigen. Nature. 1994;369:648–652. - PubMed
    1. Demkowicz WE, Jr, Ennis FA. Vaccinia virus-specific CD8+ cytotoxic T lymphocytes in humans. J. Virol. 1993;67:1538–1544. - PMC - PubMed
    1. Nanan R, Rauch A, Kämpgen E, Niewiesk S, Kreth HW. A novel sensitive approach for frequency analysis of measles virus-specific memory T-lymphocytes in healthy adults with a childhood history of natural measles. J. Gen. Virol. 2000;81:1313–1319. - PubMed
    1. De Boer RJ, Perelson AS. Quantifying T lymphocyte turnover. J. Theor. Biol. 2013;327:45–87. - PMC - PubMed

Publication types

MeSH terms