. 2018 Feb;20(2):135-143.
doi: 10.1038/s41556-017-0007-x. Epub 2017 Dec 11.

Systematic analysis of ribophagy in human cells reveals bystander flux during selective autophagy

Affiliations

Systematic analysis of ribophagy in human cells reveals bystander flux during selective autophagy

Heeseon An et al. Nat Cell Biol. 2018 Feb.

Abstract

Ribosomes are abundant cellular machines 1,2 that are regulated by assembly, supernumerary subunit turnover and nascent chain quality control mechanisms 1-5 . Moreover, nitrogen starvation in yeast has been reported to promote selective ribosome delivery to the vacuole in an autophagy conjugation system dependent manner, a process called 'ribophagy' 6,7 . However, whether ribophagy in mammals is selective or regulated is unclear. Using Ribo-Keima flux reporters, we find that starvation or mTOR inhibition promotes VPS34-dependent ribophagic flux, which, unlike yeast, is largely independent of ATG8 conjugation and occurs concomitantly with other cytosolic protein autophagic flux reporters 8,9 . Ribophagic flux was not induced upon inhibition of translational elongation or nascent chain uncoupling, but was induced in a comparatively selective manner under proteotoxic stress induced by arsenite 10 or chromosome mis-segregation 11 , dependent upon VPS34 and ATG8 conjugation. Unexpectedly, agents typically used to induce selective autophagy also promoted increased ribosome and cytosolic protein reporter flux, suggesting significant bulk or 'bystander' autophagy during what is often considered selective autophagy 12,13 . These results emphasize the importance of monitoring non-specific cargo flux when assessing selective autophagy pathways.


Figures
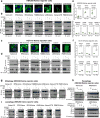
Figure 1
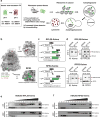
Figure 1. Construction of a system for monitoring ribophagy flux in human cells
(a) Schematic of ribophagy detection in mammalian cells using a Ribo-Keima reporter system. (b) View of the C terminus of RPL28 and RPS3 in a structure of 80S complex showing the solvent exposed site for Keima protein tagging. (PDB: 5AJ0) (c) Generation of homozygous RPL28-Keima and heterozygous RPS3-Keima reporter cell lines via CRISPR-Cas9 based gene editing. (d) Confirmation of the RPL28-Keima and RPS3-Keima expression in HEK293 and HCT116 cells by immunoblotting. Asterisk indicates Ribo-Keima protein fragments formed after the hydrolysis of the N-acyl imine in Keima chromophore during heat denaturation (see Supplemental Fig. 1d–f). Data shown represent more than three independent experiments with similar results. (e-f) Sucrose density gradient centrifugation shows proper assembly of RPL28-Keima and RPS3-Keima with 60S, 40S, 80S, and polysomes with or without 4h BTZ treatment (0.1 μM) to stabilize any unassembled subunits. Two independent experiments showed similar results. Unprocessed original scans of blots are shown in Supplemental Fig. 6.
Figure 2
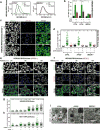
Figure 2. mTOR inhibition promotes ribophagy flux in a VPS34-dependent manner
(a) Ribo-Keima reporter cells were treated with BafA (50 nM, 1h), Torin1 (150 nM, 24h), or combination of the two, then analyzed by flow-cytometry. Frequency distributions of 561/488 nm excitation ratios are shown (n = 10,000 cells per condition). (b) The mean value of the biological triplicate experiments for 561/488 nm excitation ratios (from panel b) is shown in the histogram. Error bars represent S.E.M. (****p <0.0001, **p <0.01, *p <0.04, Two-way ANOVA). (c) Ribo-Keima reporter cell lines treated with Torin1 (150 nM, 24h), SAR405 (an inhibitor of VPS34, 1 μM, 24h), or combination of the two were immunoblotted for Keima and LC3B. (For asterisk, see Supplemental Fig. 1d) (d) Confocal images of live HEK293 cells expressing RPS3-Keima after Torin1 (150 nM, 24h) or Torin1 (150 nM, 24h)/SAR405 (1 μM, 24h) co-treatment. (Scale bar = 20 μm) (e) Unbiased quantitation of the live-cell images in panel d for number of red Keima puncta per cell are shown. Mean ± S.E.M. (n=52, 60, 60 cells from three independent experiments) (f) HEK293 RPS3-Keima cells stably expressing LAMP1-eGFP were incubated in the presence or absence of Torin1 for 24h prior to live-cell imaging. (Scale bar = 20 μm) (g) HEK293 RPS3-Keima cells treated as in (f) were stained with LysoTracker Green prior to live-cell fluorescence microscopy. (Scale bar = 20 μm) (h) HEK293 RPS3-Keima cells stably expressing eGFP-LC3 were treated as in (f), then subjected to live-cell fluorescence microscopy. (Scale bar = 20 μm) For panels f-h, co-occurrence (%) of red Keima puncta with LAMP1-eGFP (n > 1800 puncta), LysoTracker Green (n > 2000 puncta), and eGFP-LC3 n > 110 puncta) were calculated and plotted as black bars. Random co-occurrence (%) is shown as white bars (see METHODS). Mean ± S.E.M. (****p < 0.0001, ***p < 0.001, **p < 0.01, Two-way ANOVA) Statistical source data for b, f, g, h can be found in Supplementary Table 2. All experiments were performed three times with similar results. Unprocessed original scans of blots are shown in Supplemental Fig. 6.
Figure 3
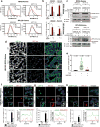
Figure 3. Ribophagy in response to mTOR inhibition in HEK293 cells is ATG5-independent but BECN1-dependent
(a) Frequency distributions of 561/488 nm excitation ratios measured on HEK293 RPS3-Keima cells lacking ATG5 or BECN1 were compared after Torin1 or Torin1/BafA treatment using flow cytometry. (n = 10,000 cells per condition) (b) Average 561/488 nm excitation ratios calculated from the biological triplicate experiments from panel a. Mean ± S.E.M. (****p < 0.0001, **p < 0.01, Two-way ANOVA) (c) Confocal images of live HEK293 RPS3-Keima cells lacking ATG5 after Torin1 (150 nM, 24h) or Torin1 (150 nM, 24h)/SAR405 (1 μM, 24h) co-treatment. (Scale bar = 20 μm) (d) Number of red Keima puncta/cell was measured from the live-cell images of HEK293 RPS3-Keima WT, ATG5−/−, or BECN1−/− cells taken after Torin1 (150 nM, 24h) or Torin1 (150 nM, 24h)/SAR405 (1 μM, 24h) co-treatment. Mean ± S.E.M. (Total number of cells from three biologically independent samples are indicated in the graph) (e,f) HEK293 RPS3-Keima cells (with or without ATG5) were incubated with HBSS in the presence of lysosomal hydrolase inhibitors (L.H.I., E64d and Pepstatin, 30 μM each) for the indicated times prior to live cell imaging. (Scale bar = 20 μm) (g) Unbiased quantification of the live-cell images obtained as shown in panels e and f. (h) Unbiased quantification of red Keima puncta obtained from live HCT116 RPL28-Keima cells (with and without ATG5) as shown in Supplemental Fig. 2g,h. In panels g and h, total number of cells from three biologically independent samples are indicated in the graph, and Mean ± S.E.M. is shown. (i) Electron microscopy images of HEK293 RPS3-Keima WT, ATG5−/− and BECN1−/− cells 4.5 h after HBSS treatment in the presence of BafA (50 nM). Red arrow: ribosomes in autophagosomes or autophagolysosomes, yellow arrow: ribosomes bound to ER in cytosol (Scale bar = 500 μm). The data shown represents two independent experiments. Statistical source data for b can be found in Supplementary Table 2. All experiments were repeated at least three times unless otherwise indicated.
Figure 4
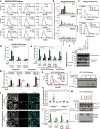
Figure 4. A screen of ribosome stress agents identifies sodium arsenite and reversine as ribophagy inducers
(a) HEK293 RPS3-Keima cells were exposed to (Tor1, 150nM, 24h; Reversine, 0.5μM, 48h; Sodium Arsenite (AS), 10μM, 24h; H2O2, 250μM, 24h; Cycloheximide, 10μM, 5h; Diazaborine, 200μM, 24h; Bortezomib, 250nM, 5h; Puromycin, 1μM, 5h; p97 inhibitor CB5083, 100nM, 24h; Tunicamycin, 0.6μM, 24h), and 561/488 ratio measured. (n=10,000 cells/condition) (b) HEK293 RPS3-Keima:WT, ATG5−/−, and BECN1−/− cells treated as in a.. Mean 561/488 ratios are plotted. (n=3 independent experiments, Supplemetary Table 2). (c) Frequency distributions of 561/488 ratios measured in HEK293 RPS3-Keima:ATG5+/+, ATG5−/− cells treated with AS. (n=4200 cells/condition) (d) The average 561/488 ratios from triplicate experiments as in panel c. (e) HEK293 RPS3-Keima:ATG5−/− cells transduced with a lentivirus expressing either ATG5 or conjugation defective ATG5K130R mutant were treated with AS (10μM, 24h). The average 561/488 ratios of biological triplicate experiments are shown. Mean of two independent experiments is shown for ATG5K130R cells. (f) Immunoblotting of indicated cells treated with AS (20μM, 20h). (g) The average 561/488 ratios of the indicated cell lines treated with Reversine (0.5μM, 48h) ± BafA (50nM, 1h). (n=3 independent experiments) (h) Frequency distributions of 561/488 ratios for HCT116 RPL28-Keima cells with or without Reversine treatment. (n=10,000 cells/condition) (i) Immunoblot of HCT116 RPL28-Keima cells treated with Reversine ± SAR405. (j) Imaging of HCT116 RPL28-Keima:ATG5+/+, ATG5−/− cells ± Reversine (0.5μM, 48h). (Scale bar=20μm) (k) Quantification of the images in panel j. Mean ± S.E.M. (Total number of cells are indicated as n) (l) The average 561/488 ratios of cells treated with Reversine (0.5μM, 48h). (n=3 independent experiments) (m) Immunoblots of indicated cell lines treated as in panel l. Mean ± S.E.M. is shown in panel b,d,e,g,l. (****p<0.0001, ***p<0.001, **p<0.01, panel b:One-way ANOVA, panel d,e,g,l:Two-way ANOVA) All experiments were repeated three times unless otherwise indicated. Statistical source data are in Supplementary Table 2. Unprocessed original scans are shown in Supplementary Fig. 6.
Figure 5
Figure 5. Quantitative Western blot analyses of various Keima reporter cell lines reveal selective capture of ribosomes during AS and Reversine treatment and the relative quantity of “by-stander” autophagy during selective autophagy
(a) Confocal images of live HEK293 cells expressing 7 different Keima reporter proteins show proper intracellular localization. (b) Extracts from the indicated cell lines treated with SAR405 (1μM, 20h), AS (20μM, 20h), or Tor1 (150nM, 20h) were subjected to immunoblotting. The representative Western blot images were developed using HRP conjugated secondary antibodies, whereas the quantitative Western blot analysis of biological triplicate experiments was performed using NIR fluorescent secondary antibodies. Blot images were processed using Odyssey CLx imager for quantitation. (c) Proper localization of Keima reporter proteins expressed in HCT116 cells is confirmed by live cell imaging. (a,c:scale bar=5μm) (d) Extracts from the indicated HCT116 Keima reporter cell lines treated with SAR405 (1μM, 20h), Tor1 (150nM, 20h), or Reversine (0.5μM, 48h) were subjected to immunoblotting. (e,f) Quantitation of immunoblots obtained as in b and d is plotted. Processed Keima band intensity of each lane was normalized by the intact Keima band intensity in the same lane. Then, the relative abundance of processed Keima in AS or Reversine treated cells was normalized with Torin1 treated cells (internal standard for each cell line). Mean ± S.E.M. Total number of biologically independent experiments are indicated in the graph. (g,h,i) “By-stander” autophagy during mitophagy, pexophagy, and lysophagy was analyzed using HEK293 Keima reporter cell lines. Corresponding cells were treated either with Antimycin A (10 μM, 15h) and Oligomycin A (5 μM, 15h) or with Clofibrate (500 μM) for indicated time to induce mitophagy and pexophagy, repectively. Keima reporter cell lines used for mitophagy analysis stably express exogenous PARKIN. To induce lysophagy, cells were treated with L-Leucyl-L-Leucine methyl ester (LLOMe, 1 mM) for 1 hour, then further incubated with fresh media for 24 hours. Red arrow indicates lysozyme resistant Keima (25kDa) fragment. All experiments were repeated more than three times unless otherwise indicated. Statistical source data can be found in Supplementary Table 2. Unprocessed original scans of blots are shown in Supplementary Fig. 6.

Similar articles

Cited by

References

    1. Warner JR. The economics of ribosome biosynthesis in yeast. Trends Biochem Sci. 1999;24:437–440. - PubMed
    1. Zhang T, Shen S, Qu J, Ghaemmaghami S. Global Analysis of Cellular Protein Flux Quantifies the Selectivity of Basal Autophagy. Cell Rep. 2016;14:2426–2439. - PMC - PubMed
    1. Shao S, Hegde RS. Target Selection during Protein Quality Control. Trends Biochem Sci. 2016;41:124–137. - PubMed
    1. Sung MK, Reitsma JM, Sweredoski MJ, Hess S, Deshaies RJ. Ribosomal proteins produced in excess are degraded by the ubiquitin-proteasome system. Mol Biol Cell. 2016;27:2642–2652. - PMC - PubMed
    1. Sung MK, et al. A conserved quality-control pathway that mediates degradation of unassembled ribosomal proteins. Elife. 2016;5 - PMC - PubMed

Publication types

MeSH terms

Substances

LinkOut - more resources