. 2017 Dec 26;114(52):E11151-E11160.
doi: 10.1073/pnas.1715361115. Epub 2017 Dec 11.

Molecular mechanism for the subversion of the retromer coat by the Legionella effector RidL

Affiliations

Molecular mechanism for the subversion of the retromer coat by the Legionella effector RidL

Miguel Romano-Moreno et al. Proc Natl Acad Sci U S A. .

Abstract

Microbial pathogens employ sophisticated virulence strategies to cause infections in humans. The intracellular pathogen Legionella pneumophila encodes RidL to hijack the host scaffold protein VPS29, a component of retromer and retriever complexes critical for endosomal cargo recycling. Here, we determined the crystal structure of L. pneumophila RidL in complex with the human VPS29-VPS35 retromer subcomplex. A hairpin loop protruding from RidL inserts into a conserved pocket on VPS29 that is also used by cellular ligands, such as Tre-2/Bub2/Cdc16 domain family member 5 (TBC1D5) and VPS9-ankyrin repeat protein for VPS29 binding. Consistent with the idea of molecular mimicry in protein interactions, RidL outcompeted TBC1D5 for binding to VPS29. Furthermore, the interaction of RidL with retromer did not interfere with retromer dimerization but was essential for association of RidL with retromer-coated vacuolar and tubular endosomes. Our work thus provides structural and mechanistic evidence into how RidL is targeted to endosomal membranes.

Keywords: Legionella effector; X-ray crystallography; coat complex; membrane targeting; pathogenic bacteria.


Conflict of interest statement

The authors declare no conflict of interest.

Figures

Fig. 1.
Fig. 1.
The N-terminal region of RidL binds retromer through VPS29. (A) Schematic representation of the different constructs of RidL used in this work. The loop region of RidL involved in binding to retromer is colored in green. The plus (+) and minus (−) show whether the indicated constructs did or did not bind to VPS29–VPS35C. (B) Pull-down of RidL variants by VPS29-[GST-VPS35C] resolved by SDS/PAGE and visualized by Coomassie blue staining. The Top shows the protein input, while the Middle proteins bound to glutathione-Sepharose beads after incubation of VPS29-[GST-VPS35C] with each of the indicated RidL constructs. The Bottom shows a parallel pull-down using GST as bait that served as a negative control. Controls with GST-tag alone exhibit minimal nonspecific binding. M, molecular mass marker (250, 150, 100, 75, 50, 37, 25, and 20 kDa). The position of the respective proteins is indicated on the right. Bands corresponding to RidL constructs are marked with white asterisks (*). (C) ITC thermograms for the titration of RidL (black) or RidL30–236 (red) with retromer. (D) ITC thermograms for the titration of RidL with VPS29 (red), VPS29–VPS35C (blue), and retromer (black). Thermodynamic binding parameters for ITC measurements in C and D are reported in Fig. S5C.
Fig. 2.
Fig. 2.
Structure of RidL1–866. (A) Overall structure of RidL1–866 (green) represented by a ribbon diagram with transparent surface. The loop segment (residues 163–176) through which binding to VPS29 occurs is marked with an arrow. Topology diagram of RidL1–866 (B) and ribbon diagram (C) colored on the basis of the different predicted domains: green (residues 6–262), orange (residues 263–429), blue (residues 430–711), red (residues 712–863), and magenta (residues 163–176).
Fig. 3.
Fig. 3.
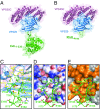
Structures of RidL in complex with retromer. (A) Overall structure of the complex formed by RidL1–236 and VPS29–VPS35C with transparent surfaces. RidL1–236 is colored in green, VPS29 in blue, and VPS35C in pink. (B) Overall structure of VPS29–VPS35C in complex with the hairpin loop of RidL (residues 163–176) with transparent surface map. The structure is colored as in A. (C) VPS29–RidLloop interaction in detail. Critical VPS29 and RidL residues are shown as sticks. Hydrogen bonds formed between the RidL hairpin loop and VPS29 are denoted by black dashed lines. (D) Electrostatic surface potential (−25 to +25 kT/e in red to blue) mapped on the surface of VPS29 structure, in the same orientation as in C. (E) Strictly conserved residues shown in Fig. S3 are mapped onto the surface of VPS29.
Fig. 4.
Fig. 4.
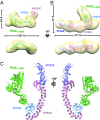
Overall assembly of the RidL–retromer complex in solution. (A and B) Ab initio molecular envelopes generated from the SAXS scattering data of the RidL1–866–VPS29–VPS35C complex (A) and RidL1–420–retromer complex (B). The crystal structures of the individual domains are docked into the envelopes. (C) Proposed model of the RidL1–866–retromer complex obtained from the superposition of RidL1–866–VPS29–VPS35C and RidL1–420–retromer complexes.
Fig. 5.
Fig. 5.
Interface residues are critical for RidL–VPS29 complex formation. (A) Coomassie blue-stained SDS/PAGE gels showing pull-down of VPS29 wild-type or the different mutants of this protein by either GST-RidL, GST-RidLΔL, or GST (control). Controls with GST-tag alone exhibit minimal nonspecific binding. The graph beneath the pull-down corresponds to densitometry-based quantification of the amount of VPS29 precipitated by the respective bait-coated beads. (B) ITC thermograms for the titration of RidL, RidLΔL, or RidL point mutants (Y166A, I170D) into solutions containing either VPS29 or mutated versions of this protein. (C) ITC thermograms for the titration of RidL into solutions containing either retromer (black) and retromer containing VPS29Y163A (red) or retromer containing VPS29Y165A (brown).
Fig. 6.
Fig. 6.
RidL localizes to endosomal compartments occupied by retromer. (A) HeLa cells were transfected with plasmids encoding either GFP-RidL1–236 or GFP-RidL1–236,∆L and imaged live 24 h later. (Scale bars, 5 µm.) (B) HeLa cells were transfected with plasmids encoding either GFP-RidL1–236 or GFP-RidL1–236,∆L and fixed 24 h before staining with antibodies against the core retromer subunit VPS26. Notice the colocalization of GFP-RidL1–236 with VPS26 on endosomal compartments. (Scale bars, 5 µm.) (C) Colocalization of GFP-RidL1–236 or GFP-RidL1–236,∆L with endogenous VPS26 in fixed cells was quantified in at least 32 cells across three independent experiments using ImageJ. Pearson’s correlation coefficient values for colocalization in individual cells are shown in the plots (****P < 0.0001 by unpaired t test with equal SD). (D) HeLa cells were cotransfected with plasmids encoding mCherry-RidL1–236 and either YFP-VPS29 or early endosome marker EEA1-GFP, and imaged live. Still images were taken from Movies S1 (VPS29) and S2 (EEA1). (Scale bars, 5 µm.) Insets show mCherry-RidL1–236+ tubules (magnification: Top, 3.6×; Bottom, 2.5×). Notice the association of mCherry-RidL1–236 with vacuolar endosomes labeled with YFP-VPS29 and EEA1-GFP, and emanating tubules labeled with YFP-VPS29 but not EEA1-GFP. (E) Colocalization of GFP-RidL1–236 or GFP-RidL1–236,∆L with expressed EEA1-GFP, VPS29-YFP, or TGN38-mCherry in live cells was quantified in at least 30 cells across three independent experiments using ImageJ. Pearson’s correlation coefficient values for colocalization in individual cells are shown in the scatter plots (****P < 0.0001, by unpaired t test with equal SD). ns, not significant.
Fig. 7.
Fig. 7.
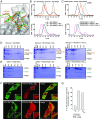
RidL competes with TBC1D5TBC for binding to retromer. (A) Superposition of the VPS29/TBC1D5–Ins1 complex (PDB ID code 5GTU) shown in orange and the VPS29–VPS35–RidLloop complex (green). (B, Upper) Gel-filtration chromatogram of the complex formed by retromer and TBC1D5TBC (black) at a molar ratio of 1:1.5. The chromatograms of retromer (red) and TBC1D5TBC (brown) are also shown. (Lower) Competition assay between RidL and TBC1D5 for retromer binding. Gel-filtration chromatogram of the complex formed by retromer and TBC1D5TBC (black), after incubation with RidL at a 1:1 molar ratio (magenta) and after the incubation with RidLΔL (cyan). (C, Upper) Gel-filtration chromatogram of the complex formed by VPS29–VPS35 and VARPc (black) at 1:1 molar ratio. The chromatograms of VPS29–VPS35 (red) and VARPc (green) are also shown. (Lower) Competition assay between RidL and VARPc for retromer binding. Gel-filtration chromatogram of the complex formed by VPS29–VPS35 and VARPc (black), after incubation with RidL (magenta) and after the incubation with RidLΔL (cyan). (D and E) Coomassie blue-stained SDS/PAGE gels of the corresponding fractions shown in the chromatograms, with the position of each protein band indicated on the right. Gels with the corresponding fractions of the competition assays between RidL and RidLΔL are shown in the Center and on the Right, respectively. (F) Overproduction of mCherry-RidL1–236 but not mCherry-RidL1–236,∆L displaces GFP-TBC1D5 from endosomes. HeLa cells were cotransfected with plasmids encoding GFP-TBC1D5 and either mCherry-RidL1–236 or mCherry-RidL1–236,∆L, and imaged live after 24 h. Inset shows endosomal recruitment of either mCherry-RidL1–236 or GFP-TBC1D5 in representative images of three independent repeats (magnification: Top, 1.8×, Bottom, 1.6×). (Scale bars, 5 µm.) (G) A minimum of 45 cells coexpressing GFP-TBC1D5 and either mCherry-RidL1–236, mCherry-RidL1–236,∆L, or mCherry vector were assessed for association of GFP-TBC1D5 signal with intracellular membranes. Bar graphs report percentage of the cell population displaying membrane-associated GFP-TBC1D5 for each condition in a single matched experiment.

Similar articles

Cited by

References

    1. Huotari J, Helenius A. Endosome maturation. EMBO J. 2011;30:3481–3500. - PMC - PubMed
    1. Scott CC, Vacca F, Gruenberg J. Endosome maturation, transport and functions. Semin Cell Dev Biol. 2014;31:2–10. - PubMed
    1. Chi RJ, Harrison MS, Burd CG. Biogenesis of endosome-derived transport carriers. Cell Mol Life Sci. 2015;72:3441–3455. - PMC - PubMed
    1. Hierro A, Gershlick DC, Rojas AL, Bonifacino JS. Formation of tubulovesicular carriers from endosomes and their fusion to the trans-Golgi network. Int Rev Cell Mol Biol. 2015;318:159–202. - PubMed
    1. van Weering JR, Verkade P, Cullen PJ. SNX-BAR proteins in phosphoinositide-mediated, tubular-based endosomal sorting. Semin Cell Dev Biol. 2010;21:371–380. - PMC - PubMed

Publication types

MeSH terms

LinkOut - more resources