. 2018 Jan;24(1):103-112.
doi: 10.1038/nm.4439. Epub 2017 Dec 11.

The molecular landscape of pediatric acute myeloid leukemia reveals recurrent structural alterations and age-specific mutational interactions

Affiliations

The molecular landscape of pediatric acute myeloid leukemia reveals recurrent structural alterations and age-specific mutational interactions

Hamid Bolouri et al. Nat Med. 2018 Jan.

Erratum in

Abstract

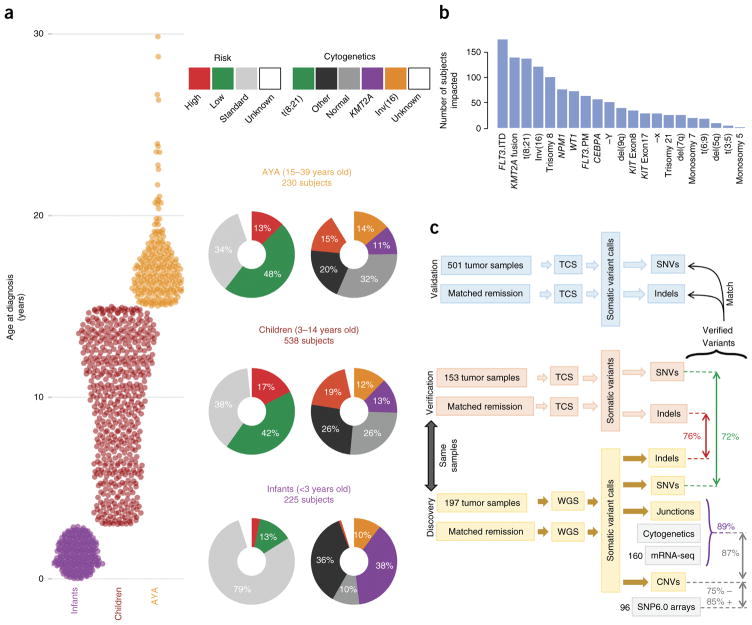
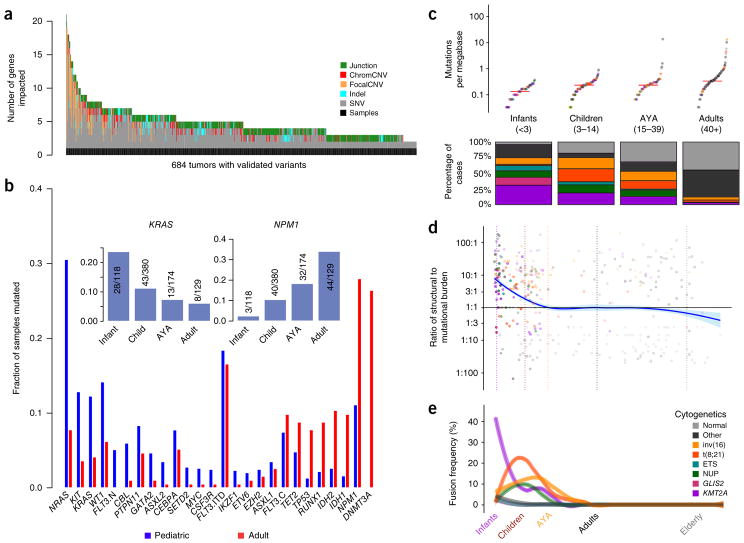
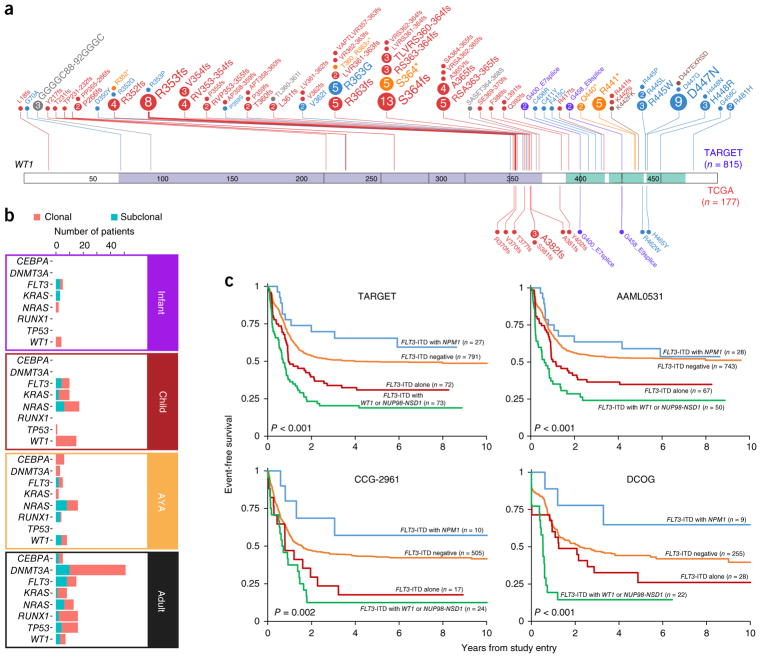
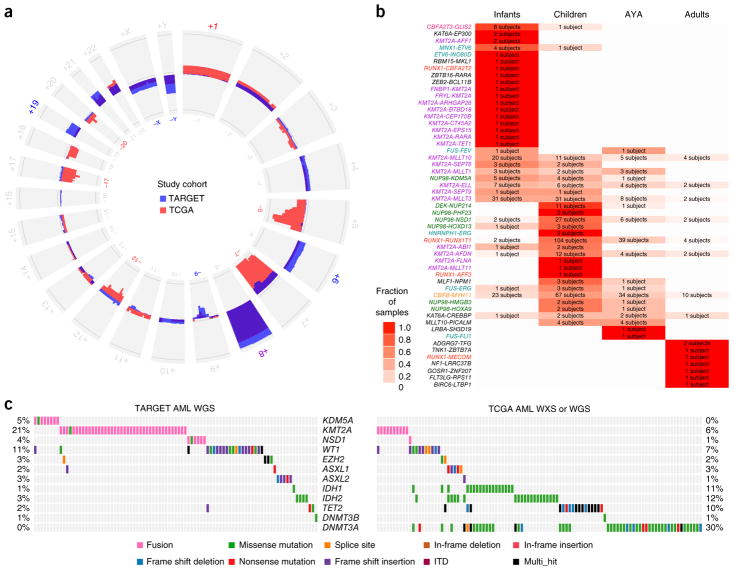
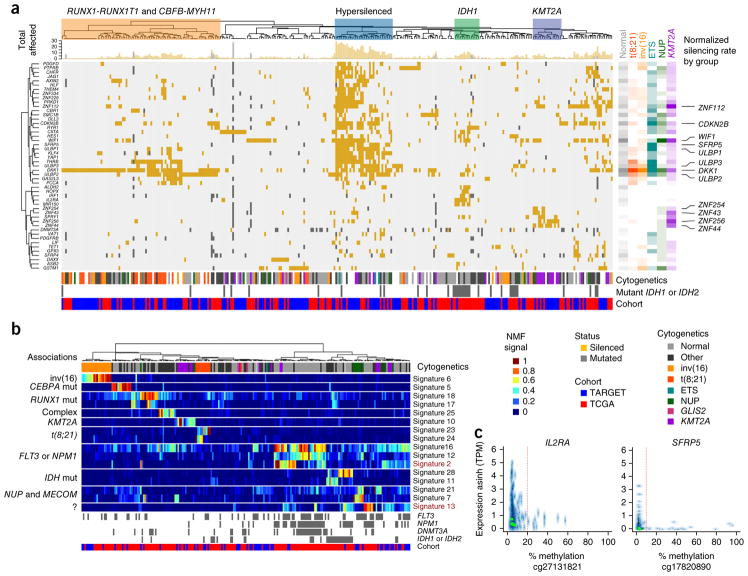
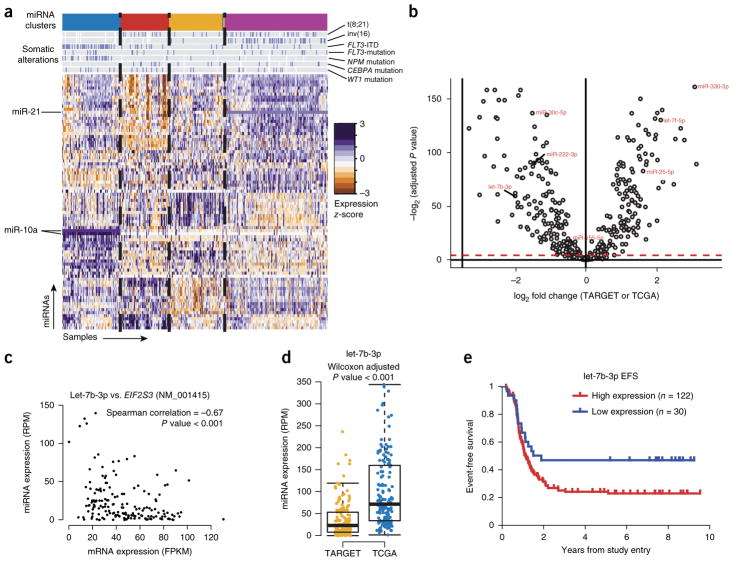
We present the molecular landscape of pediatric acute myeloid leukemia (AML) and characterize nearly 1,000 participants in Children's Oncology Group (COG) AML trials. The COG-National Cancer Institute (NCI) TARGET AML initiative assessed cases by whole-genome, targeted DNA, mRNA and microRNA sequencing and CpG methylation profiling. Validated DNA variants corresponded to diverse, infrequent mutations, with fewer than 40 genes mutated in >2% of cases. In contrast, somatic structural variants, including new gene fusions and focal deletions of MBNL1, ZEB2 and ELF1, were disproportionately prevalent in young individuals as compared to adults. Conversely, mutations in DNMT3A and TP53, which were common in adults, were conspicuously absent from virtually all pediatric cases. New mutations in GATA2, FLT3 and CBL and recurrent mutations in MYC-ITD, NRAS, KRAS and WT1 were frequent in pediatric AML. Deletions, mutations and promoter DNA hypermethylation convergently impacted Wnt signaling, Polycomb repression, innate immune cell interactions and a cluster of zinc finger-encoding genes associated with KMT2A rearrangements. These results highlight the need for and facilitate the development of age-tailored targeted therapies for the treatment of pediatric AML.


Conflict of interest statement

COMPETING FINANCIAL INTERESTS

The authors declare no competing financial interests.

Figures

Figure 1
Figure 1
An overview of the TARGET AML study. (a) The distribution of subjects by clinical risk category and cytogenetic classification is shown adjacent to each age group analyzed (infant, <3 years old; child, 3–14 years old; AYA, 15–39 years old). KMT2A indicates cytogenetic KMT2A abnormality (t(11q23)). (b) Summary of the clinically established molecular aberrations in the cohort (n = 993 subjects). FLT3.ITD, FLT3 internal tandem duplications; FLT3.PM, FLT3 Asp835 point mutations; KIT Exon8 and KIT Exon17, KIT mutations impacting the named exons. (c) Overview of the genomic variant discovery, verification and validation process. We characterized diagnostic and remission (taken as germline) samples from 197 subjects using WGS and verified 153 diagnostic–remission case pairs using TCS of genes recurrently impacted in the WGS samples (an additional 29 WGS cases were verified by TCS of diagnostic cases only; Supplementary Fig. 1). Seventy-two percent of WGS SNVs and 76% of WGS indels were confirmed through TCS (red and green text, respectively). Purple text indicates the percentage of confirmed DNA junctions. For focal copy number (CN) alterations spanning fewer than seven genes, 75% of recurrent WGS deletion or loss and 85% of gain or amplification calls matched recurrent alterations discovered by SNP6 array in 96 matching samples. For chromosomal junctions, we integrated WGS, clinical karyotyping and RNA-seq data by majority vote, confirming 89% of WGS junction calls.
Figure 2
Figure 2
Age-related differences in mutational and structural alterations in AML. (a) Distribution of variants per sample. At least one variant impacting a gene recurrently altered in pediatric AML was identified using multiplatform-validated variants in 684 subjects. Junction, protein fusion (Online Methods); chromCNV, chromosome-arm- or band-level copy variant; focalCNV, gene-level copy variant. (b) Age-dependent differences in the prevalence of mutations. FLT3 mutations are plotted in three categories: ITD (FLT3.ITD), activation loop domain (FLT3.C) and new, childhood-specific changes (FLT3.N). The inset shows a pattern of waxing or waning mutation rates across age groups that is evident in selected genes (KRAS and NPM1 are illustrated). (c) Top, childhood AML, like adult AML, has a low somatic mutation burden (Supplementary Fig. 5). Bottom, childhood AML is more frequently impacted by common cytogenetic alterations than adult AML. For the color key for ce, see the legend in e. Midlines represent medians. (d) The ratio of the structural variation burden to that of SNVs and indels is high in infancy and early childhood and declines with age. Vertical dashed lines demarcate age groups, and plot points are represented in the same colors as in e. (e) Using a sliding-window approach to account for uneven sampling by age, the incidence of common translocations in AML is shown to follow age-specific patterns (multivariate chi-squared P < 10−30) and was greatest in infants as compared to all other ages (chi-squared P < 10−22). KMT2A fusions were most common in infants (chi-squared P < 10−20), and CBF fusions tended to affect older children (chi-squared P < 10−7). ETS and NUP refer to mutations in these gene families. GLIS2 and KMT2A refer to fusions involving these genes.
Figure 3
Figure 3
Biological and prognostic interactions between alterations of WT1 and NPM1, FLT3-ITD and NUP98-NSD1 fusions. (a) WT1 mutations appear more frequently and impact new sites in childhood AML (for the TARGET cohort, which is expanded above the WT1 representation: 150 alterations among 815 subjects (18.4%); for the TCGA cohort, which is expanded beneath the WT1 representation: 13 alterations among 177 subjects (7.3%); Fisher’s exact test P = 0.0002). Circles indicate sites of mutation with circle size proportional to the number of recurrently detected alterations. Colors indicate type of mutation: red, frameshifting; blue, missense; yellow, nonsense; purple, splice site; gray, in-frame deletion; brown, in-frame insertion. The WT1 domain (purple) and zinc finger domains (green) are shaded on the band. (b) Inference of the clonal origin of selected mutations in 197 TARGET AML (infant, child and AYA) cases with WGS and 177 TCGA AML (adult) cases (Online Methods). (c) The clinical impact of FLT3-ITD is modulated by other sequence aberrations. In the TARGET cohort, 963 subjects had complete data for FLT3-ITD, NPM1 and WT1 mutation status and NUP98-NSD1 fusion status. Subjects with FLT3-ITD plus WT1 mutation and/or NUP98-NSD1 fusion (n = 73) exhibited markedly inferior event-free (multivariate P < 0.001) and overall survival (Supplementary Fig. 13), whereas co-occurrence of NPM1 mutation with FLT3-ITD was associated with improved survival. These findings are confirmed by two separate studies from which TARGET cases were selected (AAML0531 and CCG-2961) as well as an independent cohort of subjects treated on European cooperative group trials (Dutch Childhood Oncology Group; Online Methods).
Figure 4
Figure 4
Chromosomal alterations in pediatric and adult subjects with AML. (a) Patterns of regional and chromosomal gain (outward projection) and loss (inward projection) in the TARGET (blue) and TCGA (red) AML cohorts. Purple indicates the gain occurred in both cohorts. Losses of chromosomes 5q, 7 and 17 predominate in adults, whereas gains of chromosomes 4, 6 and 19 and losses of 9, X and Y are more common in younger subjects. Chromosome numbers are printed on the outside and inside of the circle plot and colored where there are large pediatric–adult differences. (b) Age-specific distributions of validated gene fusions. The fraction of events within an age group for each fusion pair is indicated by white–red shading, and the color of the fusion labels indicates the primary cytogenetic group (colors are the same as in Fig. 1a; see also Supplementary Figs. 17 and 18). The number in each box indicates the number of subjects carrying the indicated translocation (labels at left). (c) Structural and mutational aberrations affecting epigenetic regulators in subjects in the TARGET (WGS) and TCGA AML cohorts. WXS, whole-exome sequencing; Multi_hit, multiple nonsynonymous abberations affecting the same gene.
Figure 5
Figure 5
Aberrant DNA methylation in adult and pediatric AML. (a) Integrative analysis of genes with recurrent mutations, deletions or transcriptional silencing by promoter DNA hypermethylation (rows) in TARGET and TCGA AML cases (columns). Cluster associations are labeled at the top, including a prominent group enriched for younger subjects with WT1 mutations (P = 0.0012) that shows extensive transcriptional silencing across dozens of genes (blue boxed region). The cytogenetic group, IDH1 or IDH2 mutation status (gray, mutated; white, wild type or unknown) and TARGET or TCGA cohort membership (blue and red, respectively) for each sample are indicated below the main figure. The top marginal histogram indicates the total number of genes impacted for each subject. Right, gene and cytogenetic associations; rate of involvement by cytogenetic class per gene is indicated by color and shading (unfilled, no involvement; full shading, maximum observed involvement of any gene within subjects of the indicated cytogenetic grouping). Wnt regulators and activating NK cell ligands (for example, DKK1 and WIF1; and ULBP1, ULBP2 and ULBP3, respectively) are silenced across cytogenetic subtypes (labeled at far right). Distinct groups of silenced genes are also associated with subjects with mutated IDH1 or IDH2 and with subjects with rearranged KMT2A. A subset of genes (56 of 119) altered in >3 subjects and in subjects (n = 310; 168 TARGET, 142 TCGA) with one or more genes silenced by promoter methylation is illustrated (Supplementary Figs. 21 and 22, and Supplementary Tables 8 and 9, enumeration of all 119 genes in all 456 evaluable subjects.). (b) A subset (16 of 31) of DNA methylation signatures derived by NMF and in silico purification with samples ordered by hierarchical clustering of signatures (labeled at right). Genomic associations are indicated to the left of the main panel. Signature 13 does not correspond directly to any known recurrent alterations; however, it displays potential prognostic relevance, as does signature 2 (Supplementary Fig. 24). The subject-specific score matrix and display of all 31 signatures are provided in Supplementary Table 10 and Supplementary Figure 23. ?, unknown associations. (c) Examples of expression–promoter DNA methylation relationships are shown for IL2RA and SFRP5; these two genes were identified as recurrently silenced (in a) and also contribute to NMF signatures (in b). y axis, transformed expression (asinh(TPM)); x axis, promoter CpG methylation numbers below x-axis, methylation array probe identifiers; TPM, transcripts per million. The vertical red line indicates the empirically established silencing threshold.
Figure 6
Figure 6
miRNAs differentially regulate distinct molecular and age subgroups in AML. (a) Unsupervised clustering of miRNA expression patterns in 152 childhood AML cases identifies four subgroups of subjects (colored bands at top) with correlations to somatic alterations as indicated (blue bars on gray background) and subgroup-specific miRNA expression (miR-10 and miR-21 are highlighted as examples). (b) Age-related differences in miRNA expression are evident between adult (n = 162) and pediatric (n = 152) AML. The volcano plot shows differentially expressed miRNAs between adult and pediatric cases (Wilcoxon test, Benjamini–Hochberg adjusted P < 0.05; significance threshold indicated by dashed red line). (c,d) A predicted miRNA:mRNA target relationship involving let-7b (c), which was less abundant in most pediatric cases than in adult cases (d). RPM, reads per million; FPKM, fragments per kilobase of transcript per million mapped reads. In boxplots, the midline represents the median; the upper and lower perimeters mark the interquartile range (IQR); and tails mark the upper and lower bounds of 1.5 times the IQR. (e) High expression of let-7b occurred in a minority of pediatric AML cases and was associated with shorter time to relapse.

Comment in

Similar articles

Cited by

References

    1. Steliarova-Foucher E, et al. International incidence of childhood cancer, 2001–10: a population-based registry study. Lancet Oncol. 2017;18:719–731. - PMC - PubMed
    1. Li S, et al. Distinct evolution and dynamics of epigenetic and genetic heterogeneity in acute myeloid leukemia. Nat Med. 2016;22:792–799. - PMC - PubMed
    1. Cancer Genome Atlas Research Network. Genomic and epigenomic landscapes of adult de novo acute myeloid leukemia. N Engl J Med. 2013;368:2059–2074. - PMC - PubMed
    1. Papaemmanuil E, et al. Genomic classification and prognosis in acute myeloid leukemia. N Engl J Med. 2016;374:2209–2221. - PMC - PubMed
    1. Patel JP, et al. Prognostic relevance of integrated genetic profiling in acute myeloid leukemia. N Engl J Med. 2012;366:1079–1089. - PMC - PubMed

Publication types